
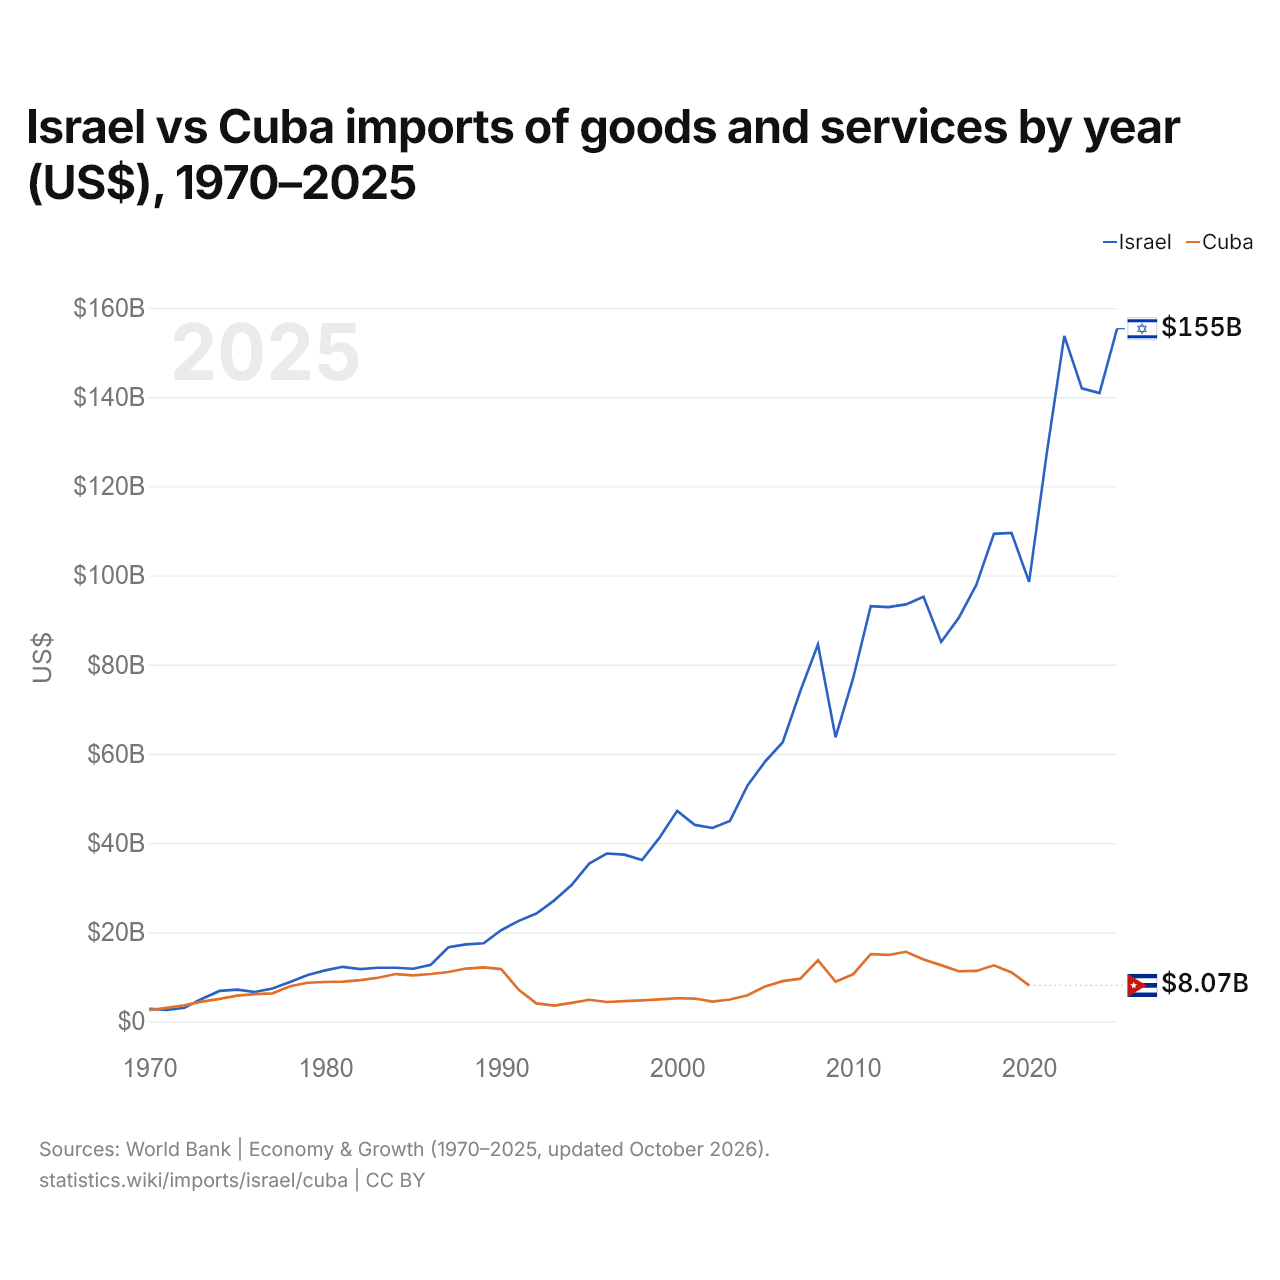
Israel vs Cuba: importações de bens e serviços por ano (US$), 1970–2025
1x
| Ano | US$ | |
|---|---|---|
 Israel |
 Cuba |
|
| 2025 | US$ 155.326.013.611 | - |
| 2024 | US$ 140.903.132.496 | - |
| 2023 | US$ 141.949.720.798 | - |
| 2022 | US$ 153.716.570.794 | - |
| 2021 | US$ 127.330.211.936 | - |
| 2020 | US$ 98.559.641.596 | US$ 8.067.000.000 |
| 2019 | US$ 109.553.655.514 | US$ 10.971.100.000 |
| 2018 | US$ 109.319.594.929 | US$ 12.567.100.000 |
| 2017 | US$ 97.866.153.832 | US$ 11.303.600.000 |
| 2016 | US$ 90.475.144.467 | US$ 11.226.300.000 |
| 2015 | US$ 85.081.011.363 | US$ 12.605.000.000 |
| 2014 | US$ 95.211.692.531 | US$ 13.865.000.000 |
| 2013 | US$ 93.509.987.330 | US$ 15.602.000.000 |
| 2012 | US$ 92.906.239.603 | US$ 14.888.000.000 |
| 2011 | US$ 93.102.471.848 | US$ 15.079.000.000 |
| 2010 | US$ 76.948.241.162 | US$ 10.555.555.556 |
| 2009 | US$ 63.709.559.037 | US$ 8.883.333.333 |
| 2008 | US$ 84.526.756.689 | US$ 13.709.351.852 |
| 2007 | US$ 74.068.549.938 | US$ 9.567.222.222 |
| 2006 | US$ 62.604.628.574 | US$ 9.022.222.222 |
| 2005 | US$ 58.276.695.189 | US$ 7.822.300.000 |
| 2004 | US$ 52.895.820.616 | US$ 5.841.100.000 |
| 2003 | US$ 44.932.193.847 | US$ 4.895.200.000 |
| 2002 | US$ 43.363.108.827 | US$ 4.434.700.000 |
| 2001 | US$ 44.056.142.854 | US$ 5.109.300.000 |
| 2000 | US$ 47.200.194.491 | US$ 5.179.600.000 |
| 1999 | US$ 41.207.853.226 | US$ 4.916.000.000 |
| 1998 | US$ 36.163.743.059 | US$ 4.697.400.000 |
| 1997 | US$ 37.372.736.708 | US$ 4.522.800.000 |
| 1996 | US$ 37.635.231.381 | US$ 4.331.000.000 |
| 1995 | US$ 35.385.120.380 | US$ 4.840.440.189 |
| 1994 | US$ 30.559.356.049 | US$ 4.135.300.811 |
| 1993 | US$ 27.078.766.828 | US$ 3.516.494.865 |
| 1992 | US$ 24.174.277.988 | US$ 4.025.942.838 |
| 1991 | US$ 22.534.110.833 | US$ 7.067.591.647 |
| 1990 | US$ 20.435.071.421 | US$ 11.708.950.532 |
| 1989 | US$ 17.498.729.910 | US$ 12.096.964.757 |
| 1988 | US$ 17.261.772.469 | US$ 11.837.456.728 |
| 1987 | US$ 16.608.825.411 | US$ 11.073.229.683 |
| 1986 | US$ 12.705.184.837 | US$ 10.606.362.971 |
| 1985 | US$ 11.785.377.046 | US$ 10.307.791.680 |
| 1984 | US$ 12.012.629.604 | US$ 10.603.443.142 |
| 1983 | US$ 12.014.412.811 | US$ 9.765.161.118 |
| 1982 | US$ 11.726.255.144 | US$ 9.251.183.529 |
| 1981 | US$ 12.228.947.368 | US$ 8.905.963.976 |
| 1980 | US$ 11.434.705.882 | US$ 8.817.697.500 |
| 1979 | US$ 10.380.400.000 | US$ 8.645.207.123 |
| 1978 | US$ 8.833.529.412 | US$ 7.878.465.455 |
| 1977 | US$ 7.348.000.000 | US$ 6.276.949.157 |
| 1976 | US$ 6.588.750.000 | US$ 6.093.814.738 |
| 1975 | US$ 7.091.666.667 | US$ 5.756.838.293 |
| 1974 | US$ 6.822.500.000 | US$ 5.038.233.171 |
| 1973 | US$ 5.057.500.000 | US$ 4.412.339.083 |
| 1972 | US$ 3.042.500.000 | US$ 3.594.369.360 |
| 1971 | US$ 2.580.000.000 | US$ 3.055.095.900 |
| 1970 | US$ 2.800.000.000 | US$ 2.515.236.800 |
As importações de bens e serviços de Israel são de US$ 155 bilhões (2025), e as de Cuba, de US$ 8,07 bilhões (2020). Em 1970, as importações de Israel foram 11% maiores: US$ 2,8 bilhões de Israel e US$ 2,52 bilhões de Cuba.
As importações de bens e serviços de Israel têm sido maiores que as de Cuba todos os anos desde 1973.
Israel vs Cuba: dados de importações
|
Israel
|
Cuba
|
|
|---|---|---|
| Importações | US$ 155 bi (2025) | US$ 8,07 bi (2020) |
| Posição mundial | 39/174 | 124/174 |
| Participação mundial | 0,46% | 0,04% |
| % do PIB | 25,4% | 7,5% |
| Maior categoria de bens | Máquinas, eletrônicos e veículos (40,1%, 2025) | Petróleo, gás, minérios e outras matérias-primas (38,5%, 2022) |
| Principal origem dos bens | China (21,8%, 2025) | China (11,5%, 2022) |
Comparar as importações de 2 países quaisquer
Fontes:
- Banco Mundial | Economy & Growth (1970–2025, atualizado em outubro de 2026)
- TradeMap (2001–2025, atualizado em outubro de 2026)
Creative Commons Atribuição (CC BY): você pode copiar, compartilhar, adaptar e reutilizar este conteúdo, inclusive para fins comerciais, desde que cite o statistics.wiki e indique as alterações que fizer. As fontes listadas acima podem ter suas próprias condições de licença.