
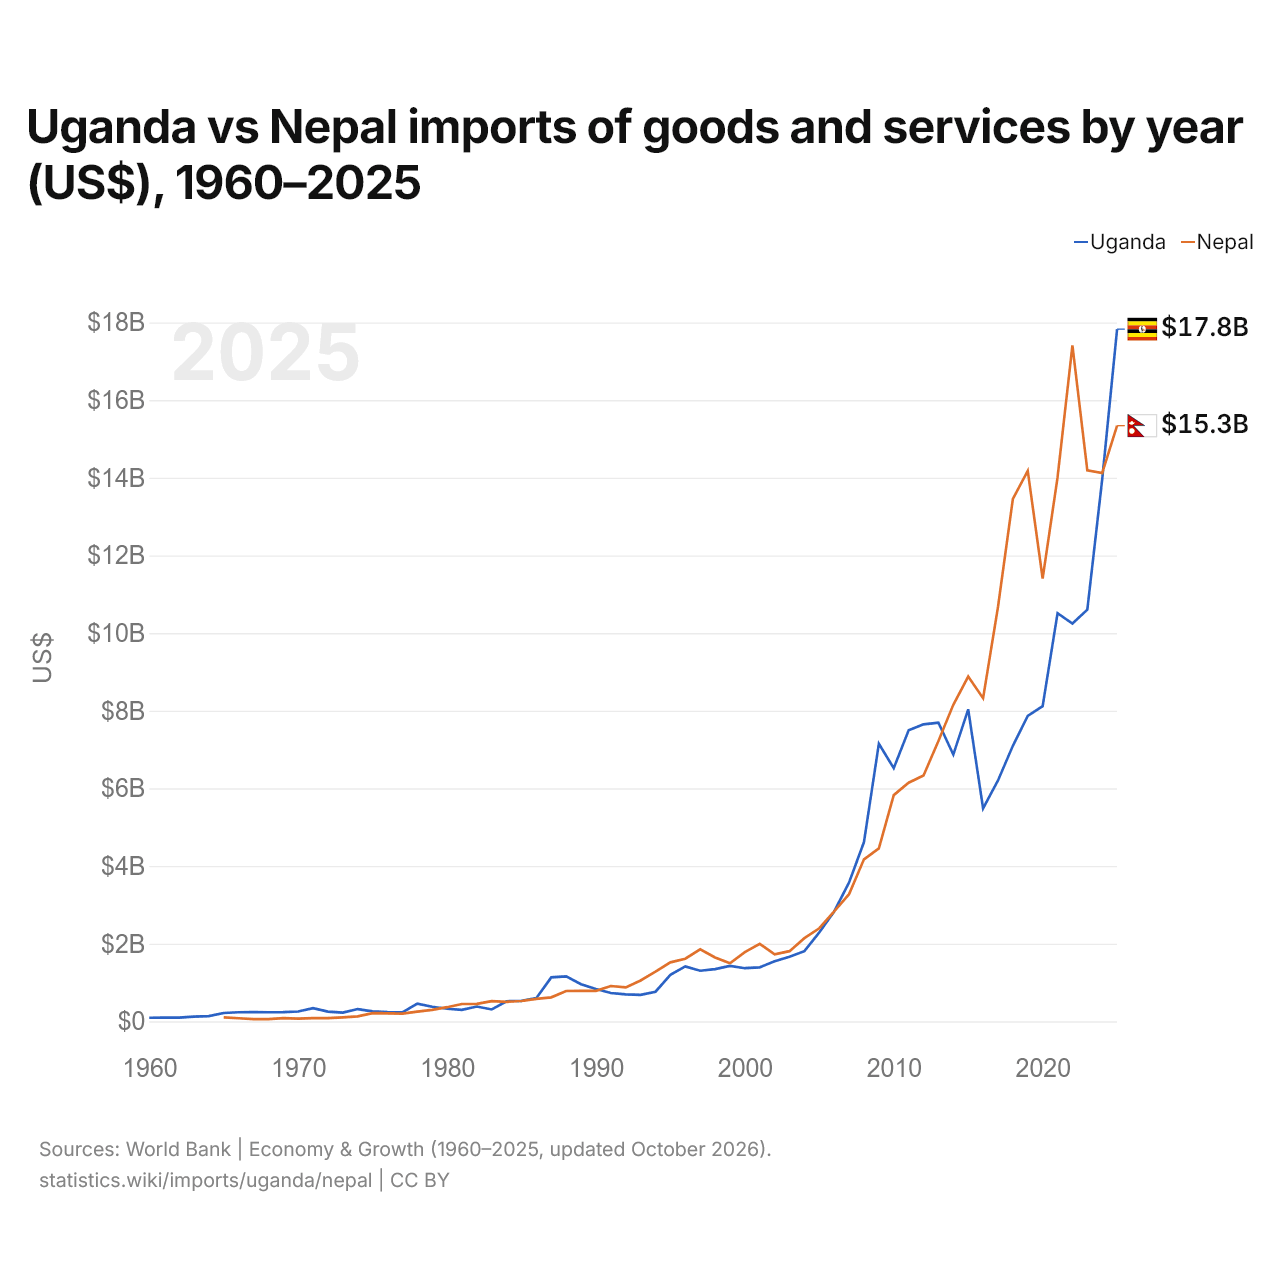
Uganda vs Nepal: importações de bens e serviços por ano (US$), 1960–2025
1x
| Ano | US$ | |
|---|---|---|
 Uganda |
 Nepal |
|
| 2025 | US$ 17.826.764.688 | US$ 15.341.170.694 |
| 2024 | US$ 13.960.593.894 | US$ 14.122.276.350 |
| 2023 | US$ 10.602.364.862 | US$ 14.188.365.495 |
| 2022 | US$ 10.244.593.521 | US$ 17.408.444.736 |
| 2021 | US$ 10.510.437.146 | US$ 14.007.303.182 |
| 2020 | US$ 8.116.375.577 | US$ 11.405.416.698 |
| 2019 | US$ 7.866.761.702 | US$ 14.176.869.011 |
| 2018 | US$ 7.096.219.372 | US$ 13.453.790.806 |
| 2017 | US$ 6.202.981.526 | US$ 10.670.300.514 |
| 2016 | US$ 5.485.150.866 | US$ 8.322.479.252 |
| 2015 | US$ 8.035.899.288 | US$ 8.879.790.220 |
| 2014 | US$ 6.870.189.627 | US$ 8.151.238.036 |
| 2013 | US$ 7.690.477.050 | US$ 7.218.389.060 |
| 2012 | US$ 7.648.498.556 | US$ 6.331.144.981 |
| 2011 | US$ 7.497.355.183 | US$ 6.146.530.703 |
| 2010 | US$ 6.520.260.385 | US$ 5.825.346.141 |
| 2009 | US$ 7.148.939.024 | US$ 4.455.549.991 |
| 2008 | US$ 4.617.770.608 | US$ 4.172.661.317 |
| 2007 | US$ 3.577.000.118 | US$ 3.275.658.805 |
| 2006 | US$ 2.829.448.599 | US$ 2.832.075.349 |
| 2005 | US$ 2.292.674.584 | US$ 2.396.740.062 |
| 2004 | US$ 1.807.281.866 | US$ 2.143.236.207 |
| 2003 | US$ 1.664.868.876 | US$ 1.807.224.670 |
| 2002 | US$ 1.548.626.997 | US$ 1.724.111.682 |
| 2001 | US$ 1.390.734.599 | US$ 1.996.693.878 |
| 2000 | US$ 1.368.560.402 | US$ 1.781.598.378 |
| 1999 | US$ 1.426.046.617 | US$ 1.495.923.473 |
| 1998 | US$ 1.343.623.399 | US$ 1.645.665.860 |
| 1997 | US$ 1.303.961.977 | US$ 1.854.725.583 |
| 1996 | US$ 1.415.906.250 | US$ 1.611.500.000 |
| 1995 | US$ 1.199.003.460 | US$ 1.519.145.030 |
| 1994 | US$ 762.125.449 | US$ 1.278.518.367 |
| 1993 | US$ 682.002.410 | US$ 1.052.504.167 |
| 1992 | US$ 694.106.644 | US$ 875.325.167 |
| 1991 | US$ 728.713.355 | US$ 909.166.931 |
| 1990 | US$ 833.711.479 | US$ 785.781.967 |
| 1989 | US$ 954.685.692 | US$ 785.537.464 |
| 1988 | US$ 1.157.116.667 | US$ 780.457.946 |
| 1987 | US$ 1.131.228.162 | US$ 618.261.969 |
| 1986 | US$ 597.834.914 | US$ 578.786.926 |
| 1985 | US$ 528.247.561 | US$ 523.971.555 |
| 1984 | US$ 517.947.171 | US$ 502.021.599 |
| 1983 | US$ 305.666.667 | US$ 521.619.390 |
| 1982 | US$ 381.500.000 | US$ 450.514.044 |
| 1981 | US$ 295.000.000 | US$ 446.416.683 |
| 1980 | US$ 324.000.000 | US$ 364.500.008 |
| 1979 | US$ 375.000.000 | US$ 295.583.342 |
| 1978 | US$ 456.521.739 | US$ 248.201.285 |
| 1977 | US$ 229.000.000 | US$ 197.919.992 |
| 1976 | US$ 235.100.000 | US$ 205.966.282 |
| 1975 | US$ 257.555.556 | US$ 210.631.428 |
| 1974 | US$ 315.796.977 | US$ 128.470.911 |
| 1973 | US$ 223.858.657 | US$ 100.827.881 |
| 1972 | US$ 250.174.997 | US$ 81.086.388 |
| 1971 | US$ 339.493.210 | US$ 80.592.593 |
| 1970 | US$ 253.394.932 | US$ 71.901.235 |
| 1969 | US$ 237.715.246 | US$ 80.592.593 |
| 1968 | US$ 234.635.307 | US$ 57.920.044 |
| 1967 | US$ 235.895.282 | US$ 58.537.866 |
| 1966 | US$ 234.355.313 | US$ 79.406.746 |
| 1965 | US$ 215.455.691 | US$ 102.375.640 |
| 1964 | US$ 136.093.399 | - |
| 1963 | US$ 123.298.894 | - |
| 1962 | US$ 96.334.175 | - |
| 1961 | US$ 95.593.893 | - |
| 1960 | US$ 92.315.052 | - |
Em 2025, as importações de bens e serviços de Uganda foram de US$ 17,8 bilhões e as do Nepal, de US$ 15,3 bilhões: as de Uganda foram 16% maiores. Em 1965, as importações de Uganda foram 2,1 vezes maiores: US$ 215 milhões de Uganda e US$ 102 milhões do Nepal.
Uganda vs Nepal: dados de importações
|
Uganda
|
Nepal
|
|
|---|---|---|
| Importações | US$ 17,8 bi (2025) | US$ 15,3 bi (2025) |
| Posição mundial | 96/174 | 102/174 |
| Participação mundial | 0,05% | 0,05% |
| % do PIB | 28,8% | 33,7% |
| Maior categoria de bens | Metais preciosos, pedras preciosas, joias, relógios, instrumentos musicais e arte (34%, 2025) | Petróleo, gás, minérios e outras matérias-primas (26,9%, 2022) |
| Principal origem dos bens | China (17,7%, 2025) | Índia (63,2%, 2022) |
Comparar as importações de 2 países quaisquer
Fontes:
- Banco Mundial | Economy & Growth (1960–2025, atualizado em outubro de 2026)
- TradeMap (2005–2025, atualizado em outubro de 2026)
Creative Commons Atribuição (CC BY): você pode copiar, compartilhar, adaptar e reutilizar este conteúdo, inclusive para fins comerciais, desde que cite o statistics.wiki e indique as alterações que fizer. As fontes listadas acima podem ter suas próprias condições de licença.