
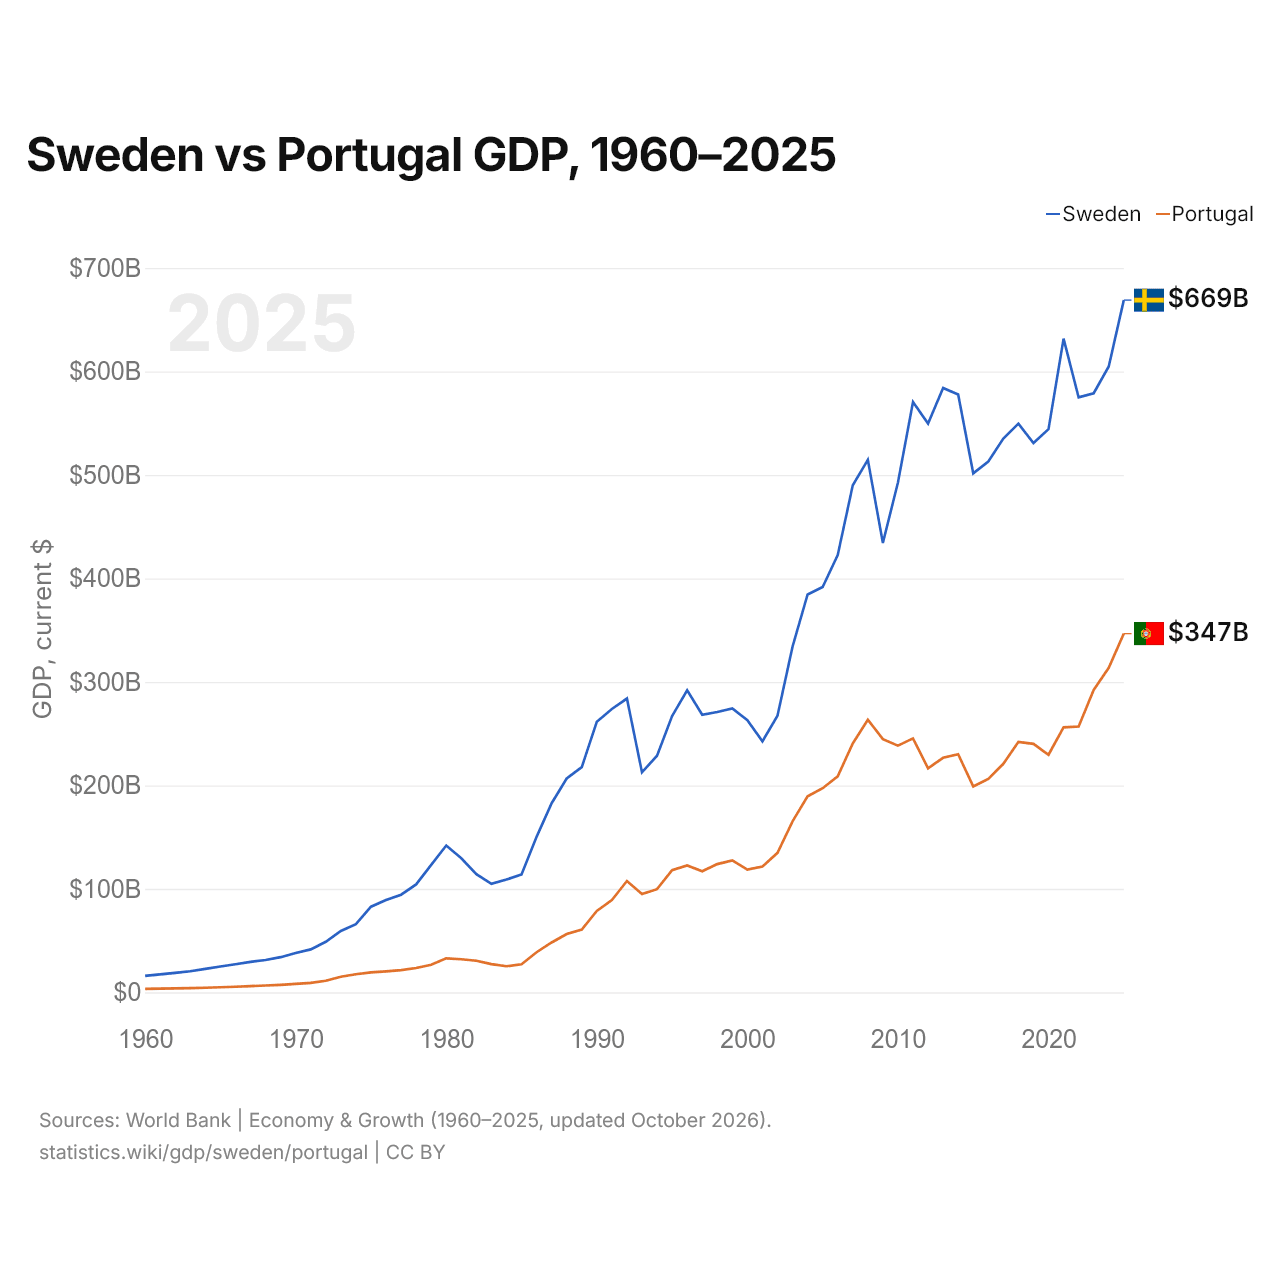
Suécia vs Portugal: PIB, 1960–2025
1x
| Ano | PIB, US$ correntes | |
|---|---|---|
 Suécia |
 Portugal |
|
| 2025 | US$ 668.998.664.082 | US$ 346.639.825.142 |
| 2024 | US$ 604.827.393.489 | US$ 313.656.884.871 |
| 2023 | US$ 578.990.915.246 | US$ 292.323.800.949 |
| 2022 | US$ 575.071.237.641 | US$ 256.898.677.175 |
| 2021 | US$ 631.693.331.301 | US$ 256.055.879.091 |
| 2020 | US$ 544.265.668.452 | US$ 229.618.773.423 |
| 2019 | US$ 530.894.124.494 | US$ 240.115.970.063 |
| 2018 | US$ 549.649.344.043 | US$ 242.092.894.543 |
| 2017 | US$ 535.172.356.785 | US$ 220.862.990.767 |
| 2016 | US$ 513.058.312.951 | US$ 206.305.431.242 |
| 2015 | US$ 501.602.351.912 | US$ 199.038.523.120 |
| 2014 | US$ 577.727.767.304 | US$ 230.078.616.300 |
| 2013 | US$ 584.125.353.119 | US$ 226.677.408.292 |
| 2012 | US$ 549.739.674.655 | US$ 216.536.676.772 |
| 2011 | US$ 570.538.581.144 | US$ 245.426.767.676 |
| 2010 | US$ 492.750.897.239 | US$ 238.443.864.993 |
| 2009 | US$ 434.311.714.442 | US$ 244.667.762.836 |
| 2008 | US$ 514.614.100.833 | US$ 263.416.394.624 |
| 2007 | US$ 490.047.789.548 | US$ 240.496.147.317 |
| 2006 | US$ 422.528.394.459 | US$ 208.756.449.276 |
| 2005 | US$ 391.688.455.929 | US$ 197.253.876.705 |
| 2004 | US$ 384.545.442.175 | US$ 189.382.122.532 |
| 2003 | US$ 334.072.443.516 | US$ 165.226.175.537 |
| 2002 | US$ 267.371.907.447 | US$ 134.795.565.549 |
| 2001 | US$ 242.497.797.485 | US$ 121.604.107.165 |
| 2000 | US$ 262.903.560.280 | US$ 118.605.192.877 |
| 1999 | US$ 274.318.357.862 | US$ 127.470.385.557 |
| 1998 | US$ 270.887.306.759 | US$ 123.946.327.916 |
| 1997 | US$ 268.249.616.891 | US$ 117.016.535.163 |
| 1996 | US$ 291.949.597.375 | US$ 122.630.089.680 |
| 1995 | US$ 267.050.453.507 | US$ 118.122.007.430 |
| 1994 | US$ 228.699.066.874 | US$ 99.688.641.304 |
| 1993 | US$ 212.644.602.616 | US$ 95.009.751.901 |
| 1992 | US$ 283.908.914.454 | US$ 107.592.098.307 |
| 1991 | US$ 273.831.464.572 | US$ 89.233.599.278 |
| 1990 | US$ 261.466.577.009 | US$ 78.713.860.217 |
| 1989 | US$ 217.632.340.195 | US$ 60.594.092.182 |
| 1988 | US$ 206.686.590.776 | US$ 56.347.250.696 |
| 1987 | US$ 182.744.315.974 | US$ 48.182.925.857 |
| 1986 | US$ 150.279.869.729 | US$ 38.745.901.354 |
| 1985 | US$ 113.958.084.357 | US$ 27.115.807.742 |
| 1984 | US$ 109.043.045.407 | US$ 25.217.969.050 |
| 1983 | US$ 104.862.109.663 | US$ 27.239.650.742 |
| 1982 | US$ 114.214.731.799 | US$ 30.527.754.793 |
| 1981 | US$ 129.498.921.476 | US$ 31.977.276.873 |
| 1980 | US$ 141.886.067.004 | US$ 32.896.519.824 |
| 1979 | US$ 123.207.527.699 | US$ 26.622.819.672 |
| 1978 | US$ 104.290.933.496 | US$ 23.487.614.051 |
| 1977 | US$ 94.331.782.622 | US$ 21.439.523.311 |
| 1976 | US$ 89.232.517.046 | US$ 20.332.831.565 |
| 1975 | US$ 82.765.232.648 | US$ 19.347.607.843 |
| 1974 | US$ 65.917.634.590 | US$ 17.512.391.476 |
| 1973 | US$ 59.318.842.992 | US$ 15.090.564.186 |
| 1972 | US$ 48.883.173.400 | US$ 11.239.117.865 |
| 1971 | US$ 41.506.151.115 | US$ 9.201.604.240 |
| 1970 | US$ 38.037.226.668 | US$ 8.108.235.704 |
| 1969 | US$ 33.967.301.561 | US$ 7.287.555.035 |
| 1968 | US$ 31.277.871.669 | US$ 6.644.693.214 |
| 1967 | US$ 29.474.881.506 | US$ 6.002.607.030 |
| 1966 | US$ 27.154.716.721 | US$ 5.370.108.031 |
| 1965 | US$ 24.963.947.415 | US$ 4.901.711.248 |
| 1964 | US$ 22.685.490.195 | US$ 4.429.202.657 |
| 1963 | US$ 20.342.131.882 | US$ 4.084.251.593 |
| 1962 | US$ 18.794.066.990 | US$ 3.835.883.663 |
| 1961 | US$ 17.329.620.585 | US$ 3.573.719.085 |
| 1960 | US$ 15.930.075.467 | US$ 3.339.150.158 |
Em 2025, o PIB da Suécia (US$ 669 bilhões) foi 1,9 vezes o de Portugal (US$ 347 bilhões). Em 2015, era 2,5 vezes. De 2015 a 2025, a preços constantes de 2015, o PIB da Suécia cresceu 16,2% e o de Portugal, 24,0%.
Desde 1960, o PIB da Suécia foi o maior dos dois todos os anos; em 1960, era 4,8 vezes o de Portugal. Em 2025, o PIB per capita foi de US$ 63.133 na Suécia e de US$ 32.082 em Portugal, 2,0 vezes maior na Suécia.
Suécia vs Portugal: dados mais recentes do PIB
|
Suécia
|
Portugal
|
|
|---|---|---|
| PIB, US$ correntes | US$ 669 bi | US$ 347 bi |
| Posição mundial | 26/197 | 46/197 |
| Participação mundial | 0,57% | 0,29% |
| PIB, US$ constantes de 2015 | US$ 583 bi | US$ 247 bi |
| Diferença de PIB | 1,9× | 0,52× |
Comparar o PIB de 2 países quaisquer
Fontes:
- Banco Mundial | Economy & Growth (1960–2025, atualizado em outubro de 2026)
Creative Commons Atribuição (CC BY): você pode copiar, compartilhar, adaptar e reutilizar este conteúdo, inclusive para fins comerciais, desde que cite o statistics.wiki e indique as alterações que fizer. As fontes listadas acima podem ter suas próprias condições de licença.