
List of countries by carbon intensity of GDP: kg CO2 per $ of GDP (PPP, 2021 prices)
| Rank | Country | kg CO2 per $ | Change since 1990 |
|---|---|---|---|
 World |
0.221 | −39.7% | |
| 1 |  Libya |
0.689 | +70.1% |
| 2 |  Trinidad |
0.613 | −28.1% |
| 3 |  Turkmenistan |
0.588 | −62.0% |
| 4 |  Iran |
0.518 | +40.0% |
| 5 |  Oman |
0.508 | +92.2% |
| 6 |  Kuwait |
0.507 | +2.7% |
| 7 |  South Africa |
0.506 | −29.1% |
| 8 |  Mongolia |
0.466 | −50.6% |
| 9 |  Qatar |
0.425 | −17.0% |
| 10 |  Iraq |
0.407 | +10.7% |
| 11 |  Bahrain |
0.405 | −27.3% |
| 12 |  China |
0.391 | −69.4% |
| 13 |  Laos |
0.390 | +1,218% |
| 14 |  Uzbekistan |
0.371 | −74.8% |
| 15 |  Kazakhstan |
0.349 | −59.4% |
| 16 |  Russia |
0.328 | −40.9% |
| 17 |  Bosnia |
0.313 | −86.3% |
| 18 |  Syria |
0.311 (2023) | −29.5% |
| 19 |  Vietnam |
0.296 | +133% |
| 20 |  Saudi Arabia |
0.293 | +16.7% |
| 21 |  UAE |
0.262 | −2.7% |
| 22 |  Algeria |
0.257 | +5.9% |
| 23 |  Brunei |
0.256 | +79.6% |
| 24 |  Jamaica |
0.251 | −31.2% |
| 25 |  Seychelles |
0.247 | +0.0% |
| 26 |  Malaysia |
0.244 | −18.9% |
| 27 |  Canada |
0.243 | −38.1% |
| 28 |  Australia |
0.234 | −47.9% |
| 29 |  Sudan |
0.233 | +176% |
| 30 |  India |
0.231 | −28.9% |
| 31 |  Tonga |
0.227 | +14.0% |
| 32 |  Vanuatu |
0.227 | +16.3% |
| 33 |  Congo |
0.217 | +88.5% |
| 34 |  Suriname |
0.212 | +36.4% |
| 35 |  Samoa |
0.209 | +14.7% |
| 36 |  Moldova |
0.208 | −69.0% |
| 37 |  Kyrgyzstan |
0.206 | −76.7% |
| 38 |  South Korea |
0.206 | −51.1% |
| 39 |  Tunisia |
0.205 | −22.0% |
| 40 |  Ukraine |
0.204 | −69.1% |
| 41 |  Belarus |
0.204 | −75.7% |
| 42 |  Bolivia |
0.202 | +36.8% |
| 43 |  Jordan |
0.200 | −40.8% |
| 44 |  Indonesia |
0.198 | +9.4% |
| 45 |  Morocco |
0.198 | −4.5% |
| 46 |  Mozambique |
0.195 | +20.1% |
| 47 |  Tajikistan |
0.194 | −64.5% |
| 48 |  Ecuador |
0.190 | +3.2% |
| 49 |  Estonia |
0.188 | −85.9% |
| 50 |  Lebanon |
0.181 | −41.8% |
| 51 |  Thailand |
0.181 | −9.6% |
| 52 |  Kiribati |
0.181 | +79.5% |
| 53 |  United States |
0.180 | −60.0% |
| 54 |  Azerbaijan |
0.173 | −76.2% |
| 55 |  Honduras |
0.172 | −57.4% |
| 56 |  Senegal |
0.171 | +63.6% |
| 57 |  Equatorial Guinea |
0.170 | +27.4% |
| 58 |  Poland |
0.167 | −78.0% |
| 59 |  Mexico |
0.166 | −18.7% |
| 60 |  North Macedonia |
0.165 | −60.7% |
| 61 |  Japan |
0.165 | −36.6% |
| 62 |  Solomon Islands |
0.163 | −19.8% |
| 63 |  Lesotho |
0.159 | +275% |
| 64 |  Cambodia |
0.157 | +614% |
| 65 |  Bulgaria |
0.155 | −74.7% |
| 66 |  Maldives |
0.155 | +229% |
| 67 |  Botswana |
0.151 | −26.4% |
| 68 |  Argentina |
0.150 | −16.7% |
| 69 |  Mauritania |
0.150 | +128% |
| 70 |  Egypt |
0.149 | −23.9% |
| 71 |  Turkey |
0.149 | −34.6% |
| 72 |  Czech Republic |
0.149 | −74.1% |
| 73 |  Zimbabwe |
0.148 | −47.5% |
| 74 |  Pakistan |
0.148 | −16.5% |
| 75 |  Zambia |
0.146 | −8.7% |
| 76 |  Georgia |
0.146 | −73.7% |
| 77 |  Philippines |
0.145 | −4.0% |
| 78 |  Comoros |
0.145 | +421% |
| 79 |  Afghanistan |
0.144 | n/a |
| 80 |  Cyprus |
0.143 | −50.6% |
| 81 |  Slovakia |
0.137 | −79.1% |
| 82 |  Malawi |
0.135 | −11.8% |
| 83 |  Greece |
0.135 | −52.6% |
| 84 |  Cape Verde |
0.131 | +69.2% |
| 85 |  Chile |
0.130 | −42.4% |
| 86 |  Antigua |
0.130 | +5.1% |
| 87 |  El Salvador |
0.129 | +60.8% |
| 88 |  Bhutan |
0.129 | +43.4% |
| 89 |  Peru |
0.129 | −14.0% |
| 90 |  Slovenia |
0.129 | −55.6% |
| 91 |  East Timor |
0.128 | +200% |
| 92 |  Mauritius |
0.127 | +1.8% |
| 93 |  Benin |
0.125 | +265% |
| 94 |  Iceland |
0.125 | −41.4% |
| 95 |  New Zealand |
0.124 | −48.9% |
| 96 |  Dominican Republic |
0.124 | −19.2% |
| 97 |  Armenia |
0.123 | −87.1% |
| 98 |  Israel |
0.122 | −59.2% |
| 99 |  Papua New Guinea |
0.120 | −30.9% |
| 100 |  Fiji |
0.119 | −28.4% |
| 101 |  Brazil |
0.118 | −2.0% |
| 102 |  Namibia |
0.117 | −6.4% |
| 103 |  Barbados |
0.117 | −5.6% |
| 104 |  Belgium |
0.115 | −58.6% |
| 105 |  Sao Tome |
0.114 | +40.8% |
| 106 |  Croatia |
0.113 | −47.5% |
| 107 |  Djibouti |
0.111 | n/a |
| 108 |  Germany |
0.111 | −63.2% |
| 109 |  Hungary |
0.109 | −66.6% |
| 110 |  Myanmar |
0.109 | −24.0% |
| 111 |  Nicaragua |
0.108 | −3.2% |
| 112 |  Gabon |
0.108 | −58.8% |
| 113 |  Burkina Faso |
0.108 | +235% |
| 114 |  Haiti |
0.107 | +153% |
| 115 |  Nepal |
0.106 | +244% |
| 116 |  Mali |
0.104 | +464% |
| 117 |  Bahamas |
0.100 | −15.7% |
| 118 |  Ghana |
0.099 | +36.0% |
| 119 |  Austria |
0.099 | −46.5% |
| 120 |  Finland |
0.099 | −65.9% |
| 121 |  Colombia |
0.097 | −40.7% |
| 122 |  Latvia |
0.097 | −77.0% |
| 123 |  Italy |
0.095 | −45.9% |
| 124 |  Lithuania |
0.095 | −79.5% |
| 125 |  Saint Kitts |
0.094 | +162% |
| 126 |  Liberia |
0.094 | +3.8% |
| 127 |  Netherlands |
0.094 | −63.4% |
| 128 |  Togo |
0.093 | +10.5% |
| 129 |  Spain |
0.093 | −50.0% |
| 130 |  Romania |
0.092 | −81.5% |
| 131 |  Madagascar |
0.088 | +131% |
| 132 |  Guinea |
0.088 | +25.7% |
| 133 |  Guatemala |
0.088 | +53.1% |
| 134 |  Ivory Coast |
0.087 | +88.2% |
| 135 |  Tanzania |
0.086 | +89.0% |
| 136 |  Grenada |
0.086 | +49.7% |
| 137 |  Eswatini |
0.085 | −63.6% |
| 138 |  Angola |
0.085 | −26.6% |
| 139 |  Bangladesh |
0.084 | +31.9% |
| 140 |  Albania |
0.082 | −77.3% |
| 141 |  Luxembourg |
0.082 | −78.7% |
| 142 |  Uruguay |
0.080 | −11.5% |
| 143 |  United Kingdom |
0.079 | −74.0% |
| 144 |  Portugal |
0.079 | −51.3% |
| 145 |  Sri Lanka |
0.077 | +35.8% |
| 146 |  Norway |
0.076 | −49.9% |
| 147 |  Panama |
0.075 | −30.3% |
| 148 |  Belize |
0.074 | −11.8% |
| 149 |  France |
0.073 | −57.3% |
| 150 |  Singapore |
0.072 | −67.9% |
| 151 |  Cameroon |
0.072 | −22.6% |
| 152 |  Nigeria |
0.071 | −50.3% |
| 153 |  Paraguay |
0.071 | +30.3% |
| 154 |  Saint Vincent |
0.070 | +99.1% |
| 155 |  Saint Lucia |
0.069 | +128% |
| 156 |  Dominica |
0.068 | +151% |
| 157 |  Niger |
0.066 | +25.6% |
| 158 |  Burundi |
0.066 | +167% |
| 159 |  Kenya |
0.066 | −2.9% |
| 160 |  Guyana |
0.065 | −79.0% |
| 161 |  Cayman Islands |
0.062 | n/a |
| 162 |  Denmark |
0.060 | −72.9% |
| 163 |  Costa Rica |
0.060 | −29.8% |
| 164 |  Chad |
0.059 | +155% |
| 165 |  Gambia |
0.058 | +33.2% |
| 166 |  Uganda |
0.057 | +30.9% |
| 167 |  Guinea-Bissau |
0.057 | −35.1% |
| 168 |  Sweden |
0.057 | −65.6% |
| 169 |  CAR |
0.057 | +52.1% |
| 170 |  Sierra Leone |
0.055 | −2.2% |
| 171 |  Malta |
0.051 | −85.9% |
| 172 |  Ireland |
0.051 | −83.7% |
| 173 |  Ethiopia |
0.051 | −3.5% |
| 174 |  Rwanda |
0.049 | −24.2% |
| 175 |  Switzerland |
0.044 | −58.0% |
| 176 |  DR Congo |
0.035 | −7.2% |
| 177 |  Somalia |
0.032 | −71.5% |
The list ranks 177 countries by their latest carbon intensity, from Libya (0.689 kg of CO2 per dollar of GDP) to Somalia (0.032 kg). The world emits 0.221 kg of CO2 per dollar of GDP. Half of the countries emit less than 0.129 kg per dollar.
The carbon intensity of GDP is a country's CO2 emissions divided by its GDP: the kilograms of carbon dioxide released for each dollar of goods and services produced. GDP is measured here in purchasing power parity at 2021 prices, which values each country's output at the same prices; at market exchange rates, the output of poorer countries would count for less and their intensity would look higher. A fall over time means the economy grew faster than its emissions.
Carbon intensity of GDP by country map
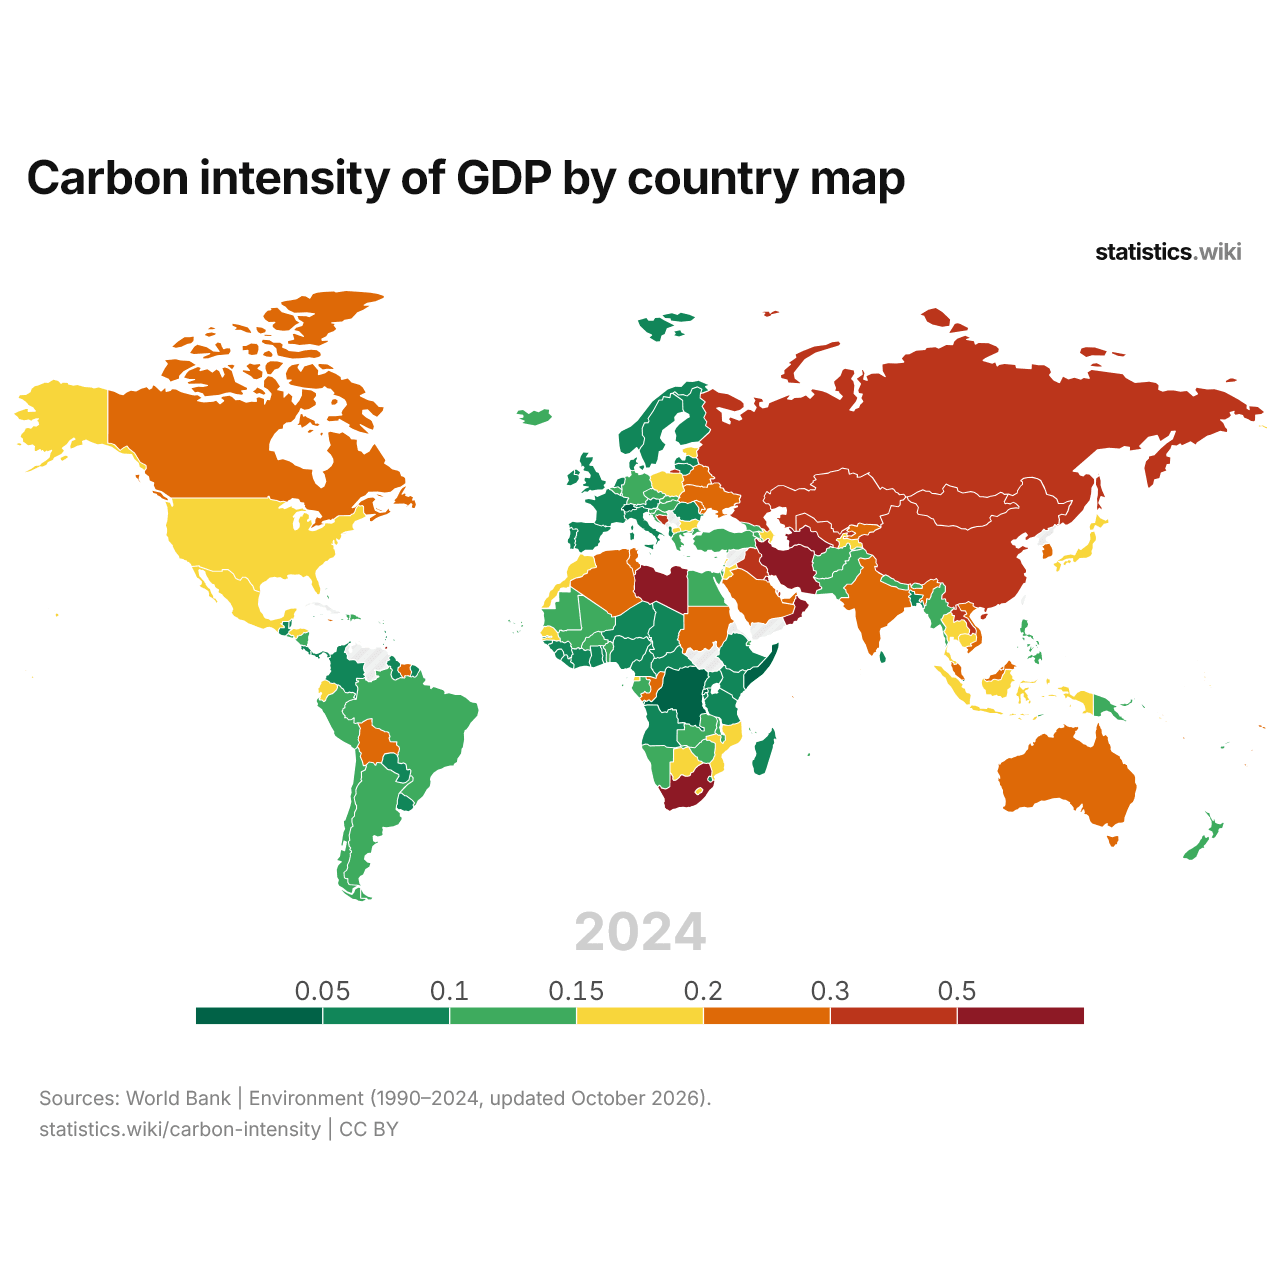
Carbon intensity is above 0.3 kg of CO2 per dollar of GDP in 17 countries and below 0.1 kg in 60; in 1990, the numbers were 51 and 49.
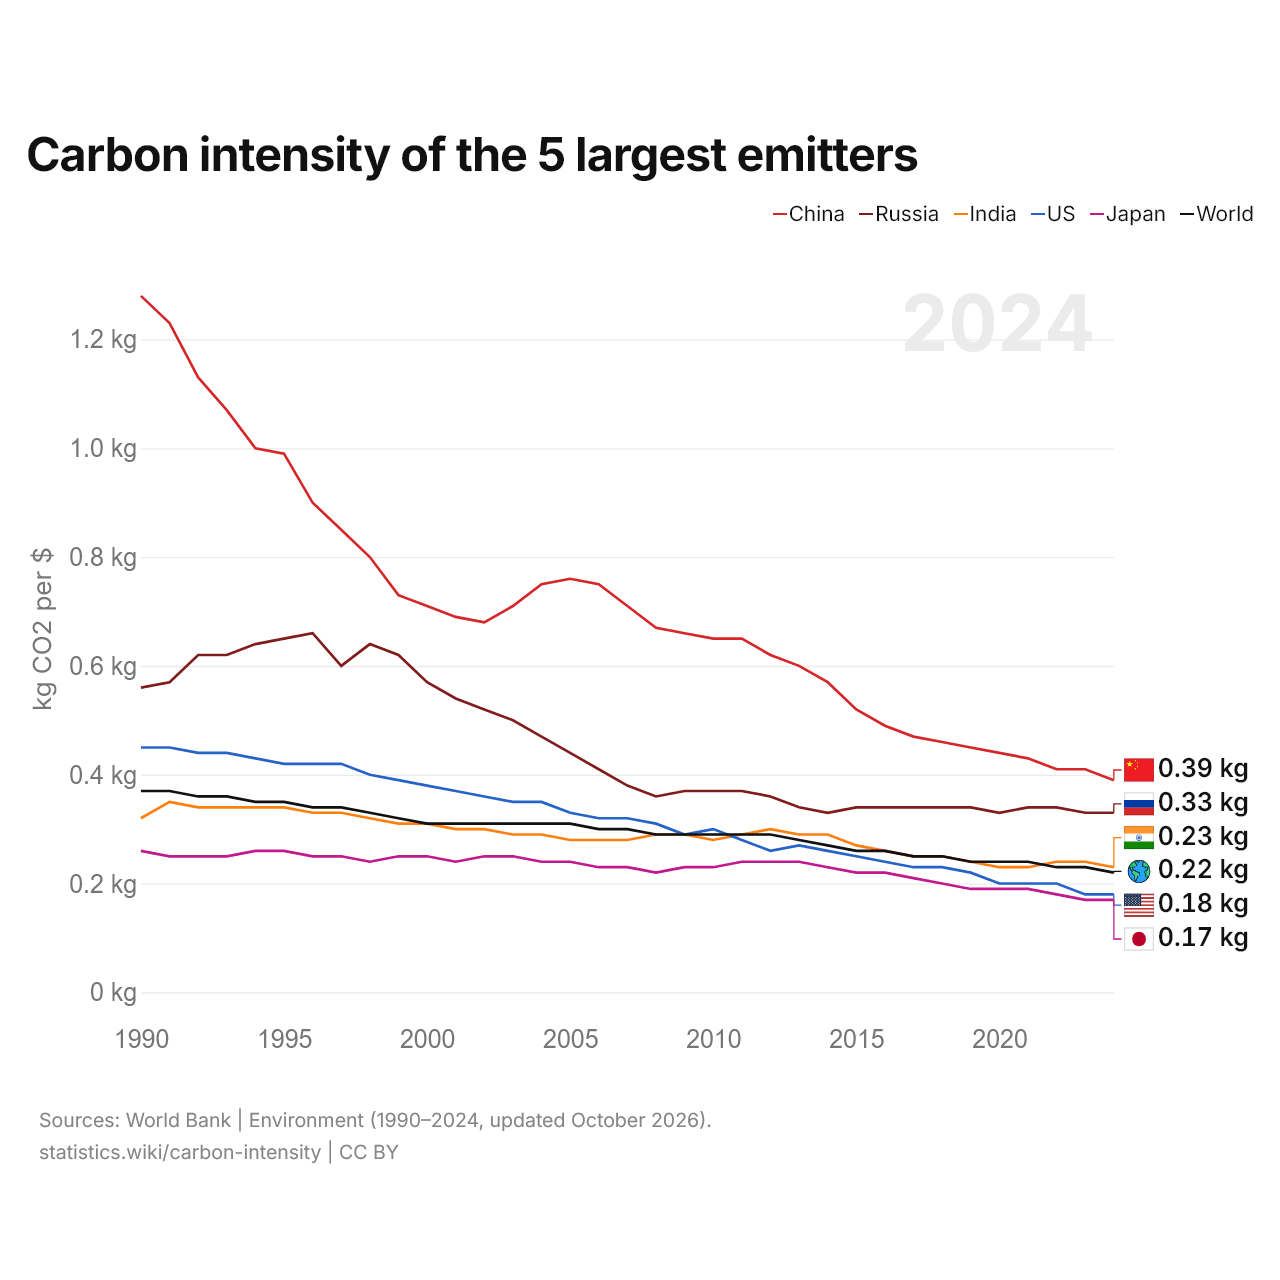
Carbon intensity of the 5 largest emitters
| Year | kg CO2 per $ | |||||
|---|---|---|---|---|---|---|
| China | Russia | India | United States | Japan | World | |
| 2024 | 0.39 kg | 0.33 kg | 0.23 kg | 0.18 kg | 0.17 kg | 0.22 kg |
| 2023 | 0.41 kg | 0.33 kg | 0.24 kg | 0.18 kg | 0.17 kg | 0.23 kg |
| 2022 | 0.41 kg | 0.34 kg | 0.24 kg | 0.2 kg | 0.18 kg | 0.23 kg |
| 2021 | 0.43 kg | 0.34 kg | 0.23 kg | 0.2 kg | 0.19 kg | 0.24 kg |
| 2020 | 0.44 kg | 0.33 kg | 0.23 kg | 0.2 kg | 0.19 kg | 0.24 kg |
| 2019 | 0.45 kg | 0.34 kg | 0.24 kg | 0.22 kg | 0.19 kg | 0.24 kg |
| 2018 | 0.46 kg | 0.34 kg | 0.25 kg | 0.23 kg | 0.2 kg | 0.25 kg |
| 2017 | 0.47 kg | 0.34 kg | 0.25 kg | 0.23 kg | 0.21 kg | 0.25 kg |
| 2016 | 0.49 kg | 0.34 kg | 0.26 kg | 0.24 kg | 0.22 kg | 0.26 kg |
| 2015 | 0.52 kg | 0.34 kg | 0.27 kg | 0.25 kg | 0.22 kg | 0.26 kg |
| 2014 | 0.57 kg | 0.33 kg | 0.29 kg | 0.26 kg | 0.23 kg | 0.27 kg |
| 2013 | 0.6 kg | 0.34 kg | 0.29 kg | 0.27 kg | 0.24 kg | 0.28 kg |
| 2012 | 0.62 kg | 0.36 kg | 0.3 kg | 0.26 kg | 0.24 kg | 0.29 kg |
| 2011 | 0.65 kg | 0.37 kg | 0.29 kg | 0.28 kg | 0.24 kg | 0.29 kg |
| 2010 | 0.65 kg | 0.37 kg | 0.28 kg | 0.3 kg | 0.23 kg | 0.29 kg |
| 2009 | 0.66 kg | 0.37 kg | 0.29 kg | 0.29 kg | 0.23 kg | 0.29 kg |
| 2008 | 0.67 kg | 0.36 kg | 0.29 kg | 0.31 kg | 0.22 kg | 0.29 kg |
| 2007 | 0.71 kg | 0.38 kg | 0.28 kg | 0.32 kg | 0.23 kg | 0.3 kg |
| 2006 | 0.75 kg | 0.41 kg | 0.28 kg | 0.32 kg | 0.23 kg | 0.3 kg |
| 2005 | 0.76 kg | 0.44 kg | 0.28 kg | 0.33 kg | 0.24 kg | 0.31 kg |
| 2004 | 0.75 kg | 0.47 kg | 0.29 kg | 0.35 kg | 0.24 kg | 0.31 kg |
| 2003 | 0.71 kg | 0.5 kg | 0.29 kg | 0.35 kg | 0.25 kg | 0.31 kg |
| 2002 | 0.68 kg | 0.52 kg | 0.3 kg | 0.36 kg | 0.25 kg | 0.31 kg |
| 2001 | 0.69 kg | 0.54 kg | 0.3 kg | 0.37 kg | 0.24 kg | 0.31 kg |
| 2000 | 0.71 kg | 0.57 kg | 0.31 kg | 0.38 kg | 0.25 kg | 0.31 kg |
| 1999 | 0.73 kg | 0.62 kg | 0.31 kg | 0.39 kg | 0.25 kg | 0.32 kg |
| 1998 | 0.8 kg | 0.64 kg | 0.32 kg | 0.4 kg | 0.24 kg | 0.33 kg |
| 1997 | 0.85 kg | 0.6 kg | 0.33 kg | 0.42 kg | 0.25 kg | 0.34 kg |
| 1996 | 0.9 kg | 0.66 kg | 0.33 kg | 0.42 kg | 0.25 kg | 0.34 kg |
| 1995 | 0.99 kg | 0.65 kg | 0.34 kg | 0.42 kg | 0.26 kg | 0.35 kg |
| 1994 | 1 kg | 0.64 kg | 0.34 kg | 0.43 kg | 0.26 kg | 0.35 kg |
| 1993 | 1.07 kg | 0.62 kg | 0.34 kg | 0.44 kg | 0.25 kg | 0.36 kg |
| 1992 | 1.13 kg | 0.62 kg | 0.34 kg | 0.44 kg | 0.25 kg | 0.36 kg |
| 1991 | 1.23 kg | 0.57 kg | 0.35 kg | 0.45 kg | 0.25 kg | 0.37 kg |
| 1990 | 1.28 kg | 0.56 kg | 0.32 kg | 0.45 kg | 0.26 kg | 0.37 kg |
Carbon intensity is 0.391 kg of CO2 per dollar of GDP in China, 0.328 in Russia, 0.231 in India, 0.180 in the United States and 0.165 in Japan. China's carbon intensity has been the highest of the five every year since 1990. The most recent change in their order came in 2011, when India's carbon intensity passed the United States'.
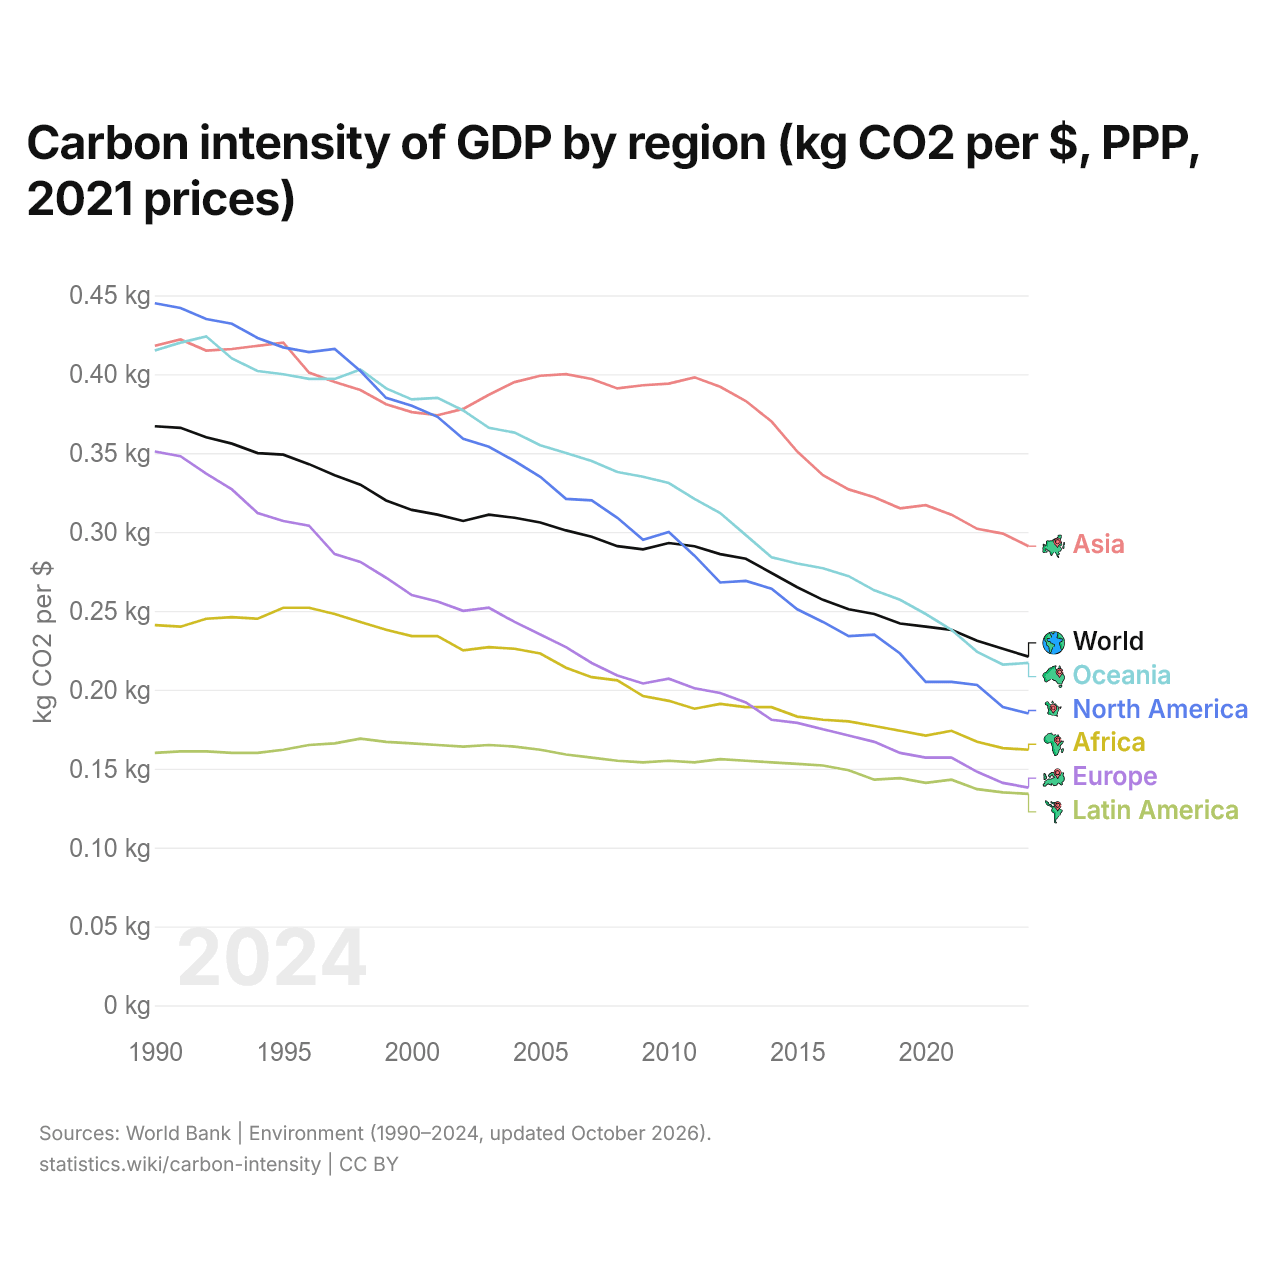
Carbon intensity of GDP by region (kg CO2 per $, PPP, 2021 prices)
| Year | kg CO2 per $ | ||||||
|---|---|---|---|---|---|---|---|
| World | Asia | Oceania | North America | Africa | Europe | Latin America | |
| 2024 | 0.221 kg | 0.291 kg | 0.217 kg | 0.185 kg | 0.162 kg | 0.138 kg | 0.134 kg |
| 2023 | 0.226 kg | 0.299 kg | 0.216 kg | 0.189 kg | 0.163 kg | 0.141 kg | 0.135 kg |
| 2022 | 0.231 kg | 0.302 kg | 0.224 kg | 0.203 kg | 0.167 kg | 0.148 kg | 0.137 kg |
| 2021 | 0.238 kg | 0.311 kg | 0.238 kg | 0.205 kg | 0.174 kg | 0.157 kg | 0.143 kg |
| 2020 | 0.24 kg | 0.317 kg | 0.248 kg | 0.205 kg | 0.171 kg | 0.157 kg | 0.141 kg |
| 2019 | 0.242 kg | 0.315 kg | 0.257 kg | 0.223 kg | 0.174 kg | 0.16 kg | 0.144 kg |
| 2018 | 0.248 kg | 0.322 kg | 0.263 kg | 0.235 kg | 0.177 kg | 0.167 kg | 0.143 kg |
| 2017 | 0.251 kg | 0.327 kg | 0.272 kg | 0.234 kg | 0.18 kg | 0.171 kg | 0.149 kg |
| 2016 | 0.257 kg | 0.336 kg | 0.277 kg | 0.243 kg | 0.181 kg | 0.175 kg | 0.152 kg |
| 2015 | 0.265 kg | 0.351 kg | 0.28 kg | 0.251 kg | 0.183 kg | 0.179 kg | 0.153 kg |
| 2014 | 0.274 kg | 0.37 kg | 0.284 kg | 0.264 kg | 0.189 kg | 0.181 kg | 0.154 kg |
| 2013 | 0.283 kg | 0.383 kg | 0.298 kg | 0.269 kg | 0.189 kg | 0.192 kg | 0.155 kg |
| 2012 | 0.286 kg | 0.392 kg | 0.312 kg | 0.268 kg | 0.191 kg | 0.198 kg | 0.156 kg |
| 2011 | 0.291 kg | 0.398 kg | 0.321 kg | 0.285 kg | 0.188 kg | 0.201 kg | 0.154 kg |
| 2010 | 0.293 kg | 0.394 kg | 0.331 kg | 0.3 kg | 0.193 kg | 0.207 kg | 0.155 kg |
| 2009 | 0.289 kg | 0.393 kg | 0.335 kg | 0.295 kg | 0.196 kg | 0.204 kg | 0.154 kg |
| 2008 | 0.291 kg | 0.391 kg | 0.338 kg | 0.309 kg | 0.206 kg | 0.209 kg | 0.155 kg |
| 2007 | 0.297 kg | 0.397 kg | 0.345 kg | 0.32 kg | 0.208 kg | 0.217 kg | 0.157 kg |
| 2006 | 0.301 kg | 0.4 kg | 0.35 kg | 0.321 kg | 0.214 kg | 0.227 kg | 0.159 kg |
| 2005 | 0.306 kg | 0.399 kg | 0.355 kg | 0.335 kg | 0.223 kg | 0.235 kg | 0.162 kg |
| 2004 | 0.309 kg | 0.395 kg | 0.363 kg | 0.345 kg | 0.226 kg | 0.243 kg | 0.164 kg |
| 2003 | 0.311 kg | 0.387 kg | 0.366 kg | 0.354 kg | 0.227 kg | 0.252 kg | 0.165 kg |
| 2002 | 0.307 kg | 0.378 kg | 0.377 kg | 0.359 kg | 0.225 kg | 0.25 kg | 0.164 kg |
| 2001 | 0.311 kg | 0.374 kg | 0.385 kg | 0.373 kg | 0.234 kg | 0.256 kg | 0.165 kg |
| 2000 | 0.314 kg | 0.376 kg | 0.384 kg | 0.38 kg | 0.234 kg | 0.26 kg | 0.166 kg |
| 1999 | 0.32 kg | 0.381 kg | 0.391 kg | 0.385 kg | 0.238 kg | 0.271 kg | 0.167 kg |
| 1998 | 0.33 kg | 0.39 kg | 0.403 kg | 0.402 kg | 0.243 kg | 0.281 kg | 0.169 kg |
| 1997 | 0.336 kg | 0.395 kg | 0.397 kg | 0.416 kg | 0.248 kg | 0.286 kg | 0.166 kg |
| 1996 | 0.343 kg | 0.401 kg | 0.397 kg | 0.414 kg | 0.252 kg | 0.304 kg | 0.165 kg |
| 1995 | 0.349 kg | 0.42 kg | 0.4 kg | 0.417 kg | 0.252 kg | 0.307 kg | 0.162 kg |
| 1994 | 0.35 kg | 0.418 kg | 0.402 kg | 0.423 kg | 0.245 kg | 0.312 kg | 0.16 kg |
| 1993 | 0.356 kg | 0.416 kg | 0.41 kg | 0.432 kg | 0.246 kg | 0.327 kg | 0.16 kg |
| 1992 | 0.36 kg | 0.415 kg | 0.424 kg | 0.435 kg | 0.245 kg | 0.337 kg | 0.161 kg |
| 1991 | 0.366 kg | 0.422 kg | 0.42 kg | 0.442 kg | 0.24 kg | 0.348 kg | 0.161 kg |
| 1990 | 0.367 kg | 0.418 kg | 0.415 kg | 0.445 kg | 0.241 kg | 0.351 kg | 0.16 kg |
Carbon intensity is highest in Asia, at 0.291 kg of CO2 per dollar of GDP, and lowest in Latin America, at 0.134 kg. The world's carbon intensity has fallen from 0.367 kg in 1990 to 0.221 kg.
Compare the carbon intensity of GDP of any 2 countries
Sources:
- World Bank | Environment (1990–2024, updated October 2026)
Creative Commons Attribution (CC BY): you may copy, share, adapt and reuse this content, also commercially, as long as you credit statistics.wiki and note any changes you made. The sources listed above may have their own license terms.