
Trinidad and Tobago carbon intensity of GDP (kg CO2 per $, PPP, 2021 prices)
| Year | kg CO2 per $ | World rank |
|---|---|---|
| 2024 | 0.613 kg | #2 |
| 2023 | 0.632 kg | #3 |
| 2022 | 0.678 kg | #3 |
| 2021 | 0.688 kg | #2 |
| 2020 | 0.71 kg | #1 |
| 2019 | 0.722 kg | #1 |
| 2018 | 0.712 kg | #2 |
| 2017 | 0.704 kg | #2 |
| 2016 | 0.693 kg | #2 |
| 2015 | 0.699 kg | #2 |
| 2014 | 0.705 kg | #3 |
| 2013 | 0.733 kg | #2 |
| 2012 | 0.773 kg | #2 |
| 2011 | 0.893 kg | #2 |
| 2010 | 0.886 kg | #2 |
| 2009 | 0.835 kg | #2 |
| 2008 | 0.824 kg | #3 |
| 2007 | 0.869 kg | #3 |
| 2006 | 0.891 kg | #3 |
| 2005 | 0.916 kg | #3 |
| 2004 | 0.803 kg | #3 |
| 2003 | 0.814 kg | #3 |
| 2002 | 0.806 kg | #3 |
| 2001 | 0.805 kg | #3 |
| 2000 | 0.74 kg | #3 |
| 1999 | 0.761 kg | #3 |
| 1998 | 0.8 kg | #4 |
| 1997 | 0.715 kg | #9 |
| 1996 | 0.77 kg | #9 |
| 1995 | 0.767 kg | #11 |
| 1994 | 0.825 kg | #10 |
| 1993 | 0.773 kg | #11 |
| 1992 | 0.787 kg | #11 |
| 1991 | 0.844 kg | #11 |
| 1990 | 0.852 kg | #10 |
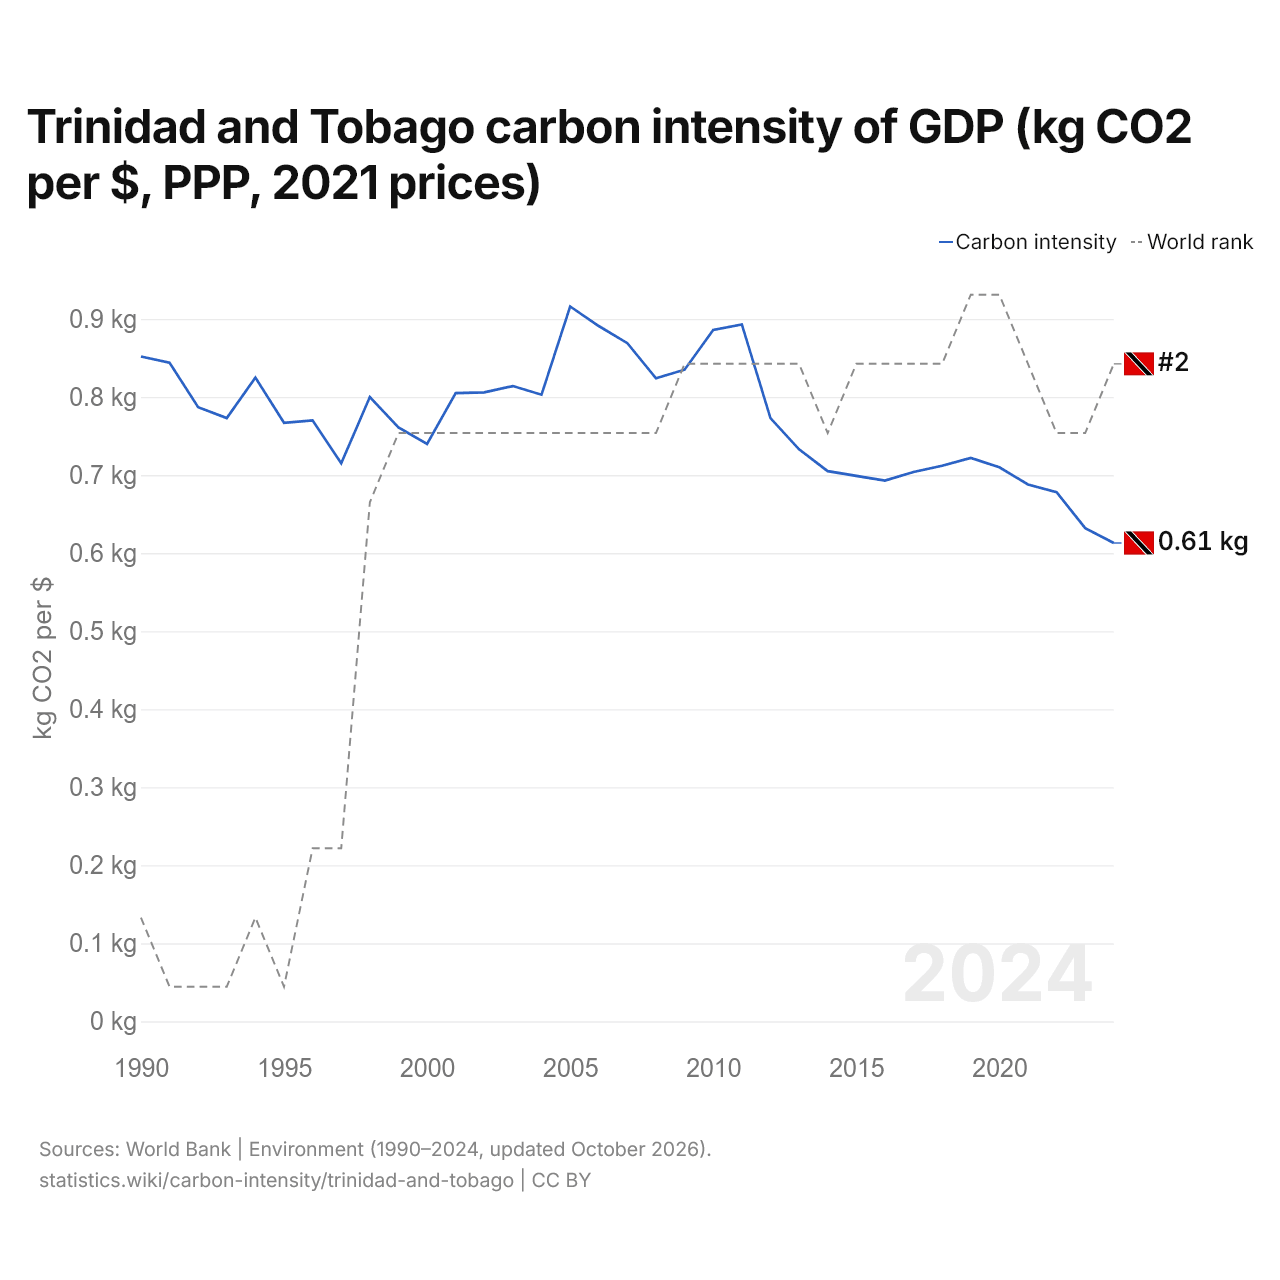
The carbon intensity of GDP in Trinidad and Tobago is 0.613 kg of CO2 per dollar, down from 0.852 kg in 1990. Trinidad and Tobago's is 2.8 times the world's 0.221 kg. Its carbon intensity was highest in 2005, at 0.916 kg. It is the 2nd highest in the world, up from 3rd the year before. Its highest rank was 1st, last held in 2020.
Trinidad and Tobago's carbon intensity is the highest of 32 countries in Latin America, ahead of Jamaica's 0.251 kg. The largest ten-year fall in Trinidad and Tobago's carbon intensity was from 2010 to 2020, by 0.176 kg; the largest ten-year rise was from 2000 to 2010, by 0.146 kg.
Trinidad and Tobago in the world carbon intensity of GDP ranking
| Rank | Country | kg CO2 per $ | Change since 1990 | |
|---|---|---|---|---|
| 1 |
 Libya |
0.689 | +70.1% | |
| 2 |
 Trinidad |
0.613 | −28.1% | |
| 3 |
 Turkmenistan |
0.588 | −62.0% | |
| 4 |
 Iran |
0.518 | +40.0% | |
| 5 |
 Oman |
0.508 | +92.2% | |
| 6 |
 Kuwait |
0.507 | +2.7% | |
| 7 |
 South Africa |
0.506 | −29.1% |
Compare Trinidad and Tobago carbon intensity of GDP with other countries
Sources:
- World Bank | Environment (1990–2024, updated October 2026)
Creative Commons Attribution (CC BY): you may copy, share, adapt and reuse this content, also commercially, as long as you credit statistics.wiki and note any changes you made. The sources listed above may have their own license terms.