
Turkmenistan carbon intensity of GDP (kg CO2 per $, PPP, 2021 prices)
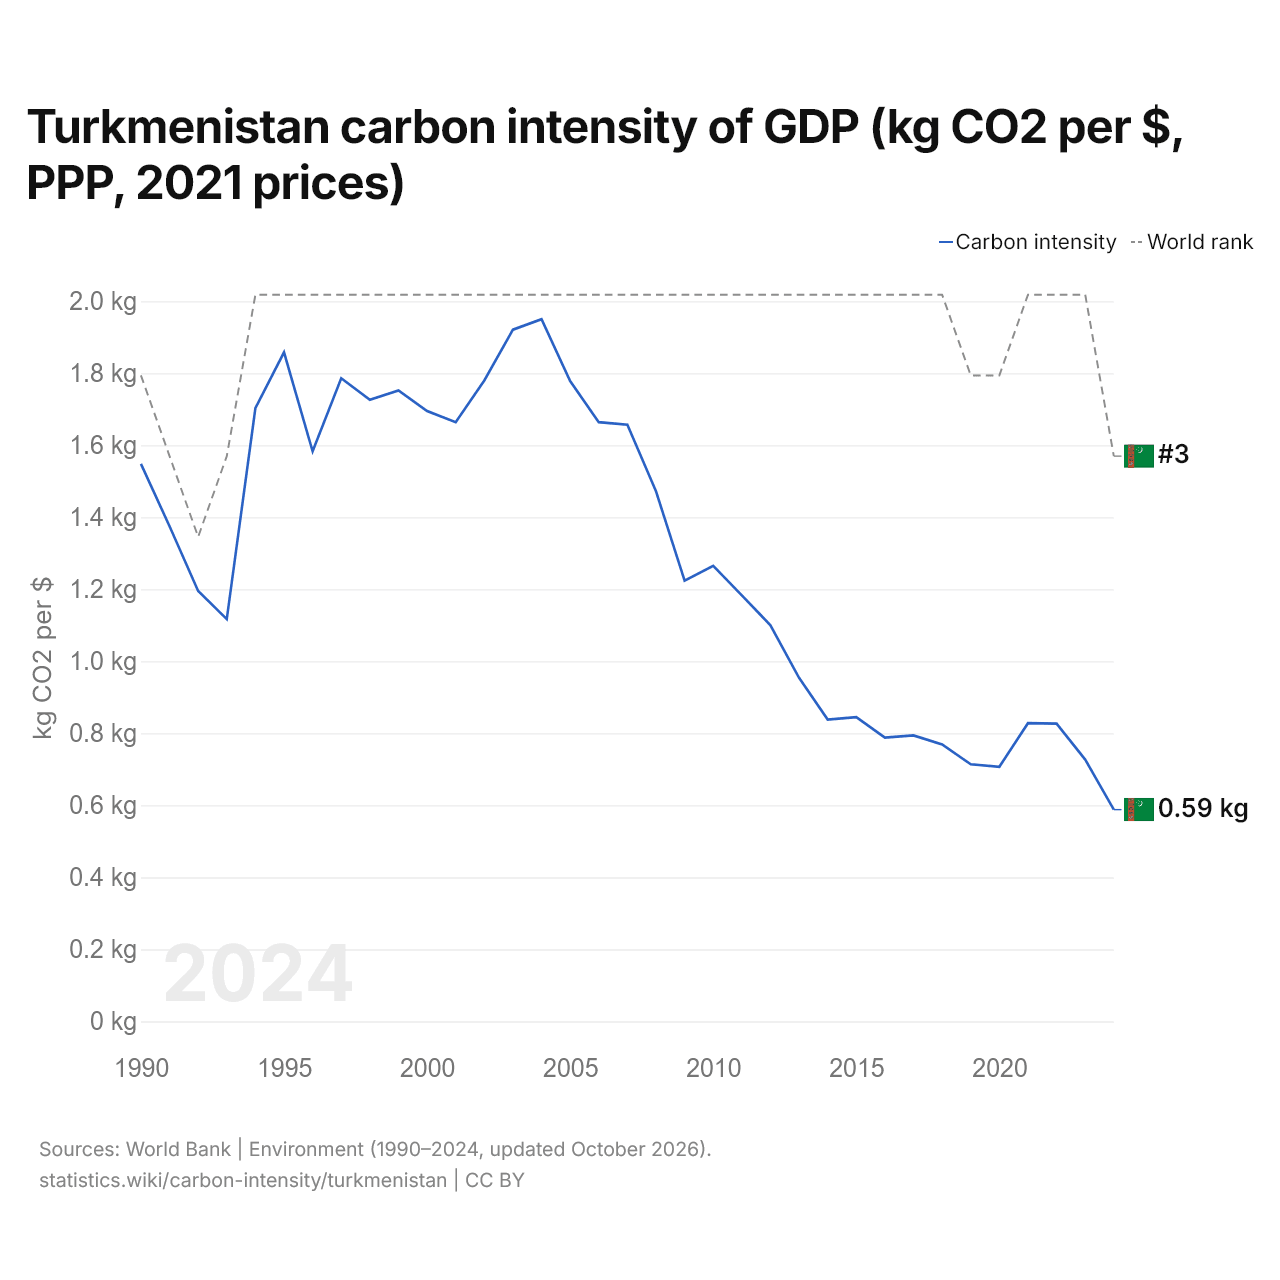
| Year | kg CO2 per $ | World rank |
|---|---|---|
| 2024 | 0.588 kg | #3 |
| 2023 | 0.727 kg | #1 |
| 2022 | 0.827 kg | #1 |
| 2021 | 0.828 kg | #1 |
| 2020 | 0.707 kg | #2 |
| 2019 | 0.714 kg | #2 |
| 2018 | 0.769 kg | #1 |
| 2017 | 0.794 kg | #1 |
| 2016 | 0.788 kg | #1 |
| 2015 | 0.845 kg | #1 |
| 2014 | 0.838 kg | #1 |
| 2013 | 0.954 kg | #1 |
| 2012 | 1.1 kg | #1 |
| 2011 | 1.183 kg | #1 |
| 2010 | 1.265 kg | #1 |
| 2009 | 1.224 kg | #1 |
| 2008 | 1.472 kg | #1 |
| 2007 | 1.657 kg | #1 |
| 2006 | 1.664 kg | #1 |
| 2005 | 1.778 kg | #1 |
| 2004 | 1.95 kg | #1 |
| 2003 | 1.921 kg | #1 |
| 2002 | 1.78 kg | #1 |
| 2001 | 1.664 kg | #1 |
| 2000 | 1.695 kg | #1 |
| 1999 | 1.752 kg | #1 |
| 1998 | 1.726 kg | #1 |
| 1997 | 1.786 kg | #1 |
| 1996 | 1.583 kg | #1 |
| 1995 | 1.858 kg | #1 |
| 1994 | 1.703 kg | #1 |
| 1993 | 1.117 kg | #3 |
| 1992 | 1.195 kg | #4 |
| 1991 | 1.375 kg | #3 |
| 1990 | 1.548 kg | #2 |
The carbon intensity of GDP in Turkmenistan is 0.588 kg of CO2 per dollar, down from 1.548 kg in 1990. Turkmenistan's is 2.7 times the world's 0.221 kg. Its carbon intensity was highest in 2004, at 1.950 kg. It is the 3rd highest in the world, down from 1st the year before. Its highest rank was 1st, last held in 2023.
Turkmenistan's carbon intensity is the highest of 44 countries in Asia, ahead of Iran's 0.518 kg. The largest ten-year fall in Turkmenistan's carbon intensity was from 2010 to 2020, by 0.558 kg; the largest ten-year rise was from 1990 to 2000, by 0.147 kg.
Turkmenistan in the world carbon intensity of GDP ranking







Compare Turkmenistan carbon intensity of GDP with other countries
Sources:
- World Bank | Environment (1990–2024, updated October 2026)
Creative Commons Attribution (CC BY): you may copy, share, adapt and reuse this content, also commercially, as long as you credit statistics.wiki and note any changes you made. The sources listed above may have their own license terms.