
Libya carbon intensity of GDP (kg CO2 per $, PPP, 2021 prices)
| Year | kg CO2 per $ | World rank |
|---|---|---|
| 2024 | 0.689 kg | #1 |
| 2023 | 0.693 kg | #2 |
| 2022 | 0.703 kg | #2 |
| 2021 | 0.647 kg | #3 |
| 2020 | 0.65 kg | #3 |
| 2019 | 0.577 kg | #3 |
| 2018 | 0.51 kg | #4 |
| 2017 | 0.533 kg | #4 |
| 2016 | 0.652 kg | #3 |
| 2015 | 0.684 kg | #3 |
| 2014 | 0.769 kg | #2 |
| 2013 | 0.6 kg | #4 |
| 2012 | 0.494 kg | #9 |
| 2011 | 0.649 kg | #4 |
| 2010 | 0.464 kg | #13 |
| 2009 | 0.461 kg | #12 |
| 2008 | 0.418 kg | #13 |
| 2007 | 0.393 kg | #17 |
| 2006 | 0.446 kg | #11 |
| 2005 | 0.477 kg | #12 |
| 2004 | 0.492 kg | #11 |
| 2003 | 0.52 kg | #11 |
| 2002 | 0.545 kg | #9 |
| 2001 | 0.527 kg | #12 |
| 2000 | 0.523 kg | #12 |
| 1999 | 0.526 kg | #14 |
| 1998 | 0.515 kg | #17 |
| 1997 | 0.502 kg | #19 |
| 1996 | 0.57 kg | #18 |
| 1995 | 0.554 kg | #18 |
| 1994 | 0.478 kg | #23 |
| 1993 | 0.418 kg | #32 |
| 1992 | 0.378 kg | #34 |
| 1991 | 0.353 kg | #38 |
| 1990 | 0.405 kg | #34 |
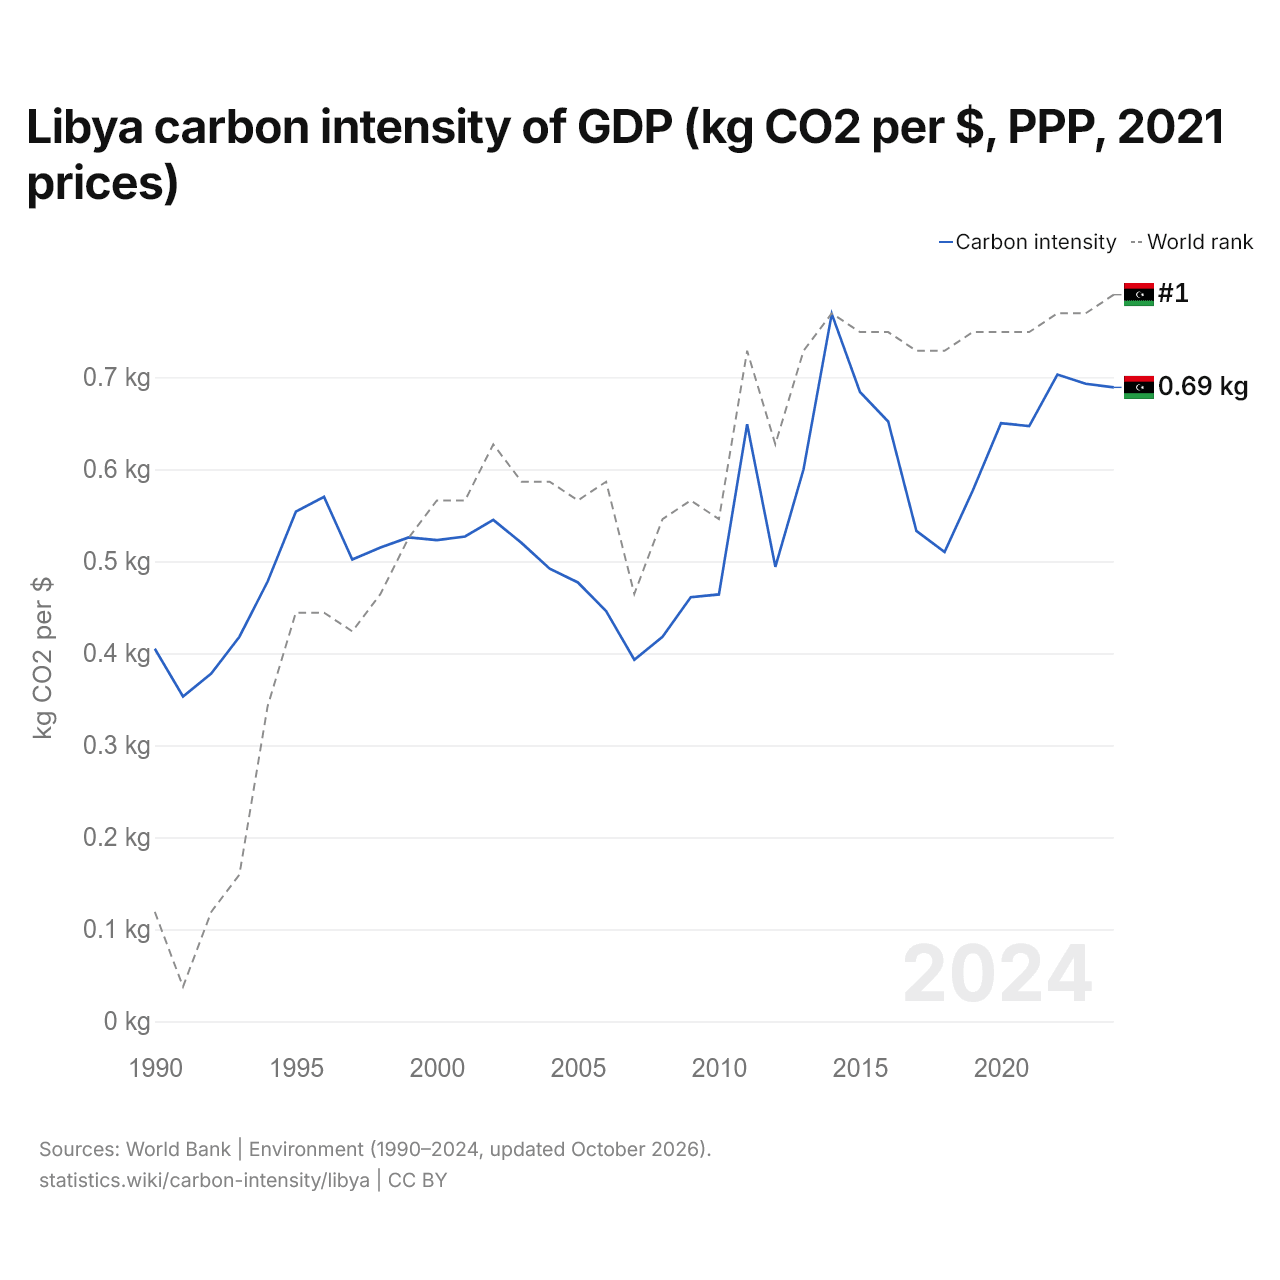
The carbon intensity of GDP in Libya is 0.689 kg of CO2 per dollar, up from 0.405 kg in 1990. Libya's is 3.1 times the world's 0.221 kg. Its carbon intensity was highest in 2014, at 0.769 kg. It is the highest in the world, up from 2nd the year before.
Libya's carbon intensity is the highest of 52 countries in Africa, ahead of South Africa's 0.506 kg. The largest ten-year rise in Libya's carbon intensity was from 2010 to 2020, by 0.186 kg; the largest ten-year fall was from 2000 to 2010, by 0.059 kg.
Libya in the world carbon intensity of GDP ranking
| Rank | Country | kg CO2 per $ | Change since 1990 | |
|---|---|---|---|---|
| 1 |
 Libya |
0.689 | +70.1% | |
| 2 |
 Trinidad |
0.613 | −28.1% | |
| 3 |
 Turkmenistan |
0.588 | −62.0% | |
| 4 |
 Iran |
0.518 | +40.0% | vs Iran |
| 5 |
 Oman |
0.508 | +92.2% | |
| 6 |
 Kuwait |
0.507 | +2.7% | |
| 7 |
 South Africa |
0.506 | −29.1% |
Compare Libya carbon intensity of GDP with other countries
Sources:
- World Bank | Environment (1990–2024, updated October 2026)
Creative Commons Attribution (CC BY): you may copy, share, adapt and reuse this content, also commercially, as long as you credit statistics.wiki and note any changes you made. The sources listed above may have their own license terms.