
Libya vs Egypt carbon intensity of GDP (kg CO2 per $, PPP, 2021 prices)
1x
| Year | kg CO2 per $ | |
|---|---|---|
 Libya |
 Egypt |
|
| 2024 | 0.689 kg | 0.149 kg |
| 2023 | 0.693 kg | 0.144 kg |
| 2022 | 0.703 kg | 0.141 kg |
| 2021 | 0.647 kg | 0.151 kg |
| 2020 | 0.65 kg | 0.147 kg |
| 2019 | 0.577 kg | 0.147 kg |
| 2018 | 0.51 kg | 0.167 kg |
| 2017 | 0.533 kg | 0.18 kg |
| 2016 | 0.652 kg | 0.179 kg |
| 2015 | 0.684 kg | 0.179 kg |
| 2014 | 0.769 kg | 0.182 kg |
| 2013 | 0.6 kg | 0.184 kg |
| 2012 | 0.494 kg | 0.191 kg |
| 2011 | 0.649 kg | 0.184 kg |
| 2010 | 0.464 kg | 0.181 kg |
| 2009 | 0.461 kg | 0.189 kg |
| 2008 | 0.418 kg | 0.19 kg |
| 2007 | 0.393 kg | 0.203 kg |
| 2006 | 0.446 kg | 0.204 kg |
| 2005 | 0.477 kg | 0.206 kg |
| 2004 | 0.492 kg | 0.193 kg |
| 2003 | 0.52 kg | 0.185 kg |
| 2002 | 0.545 kg | 0.187 kg |
| 2001 | 0.527 kg | 0.187 kg |
| 2000 | 0.523 kg | 0.175 kg |
| 1999 | 0.526 kg | 0.189 kg |
| 1998 | 0.515 kg | 0.186 kg |
| 1997 | 0.502 kg | 0.186 kg |
| 1996 | 0.57 kg | 0.184 kg |
| 1995 | 0.554 kg | 0.18 kg |
| 1994 | 0.478 kg | 0.176 kg |
| 1993 | 0.418 kg | 0.192 kg |
| 1992 | 0.378 kg | 0.197 kg |
| 1991 | 0.353 kg | 0.198 kg |
| 1990 | 0.405 kg | 0.196 kg |
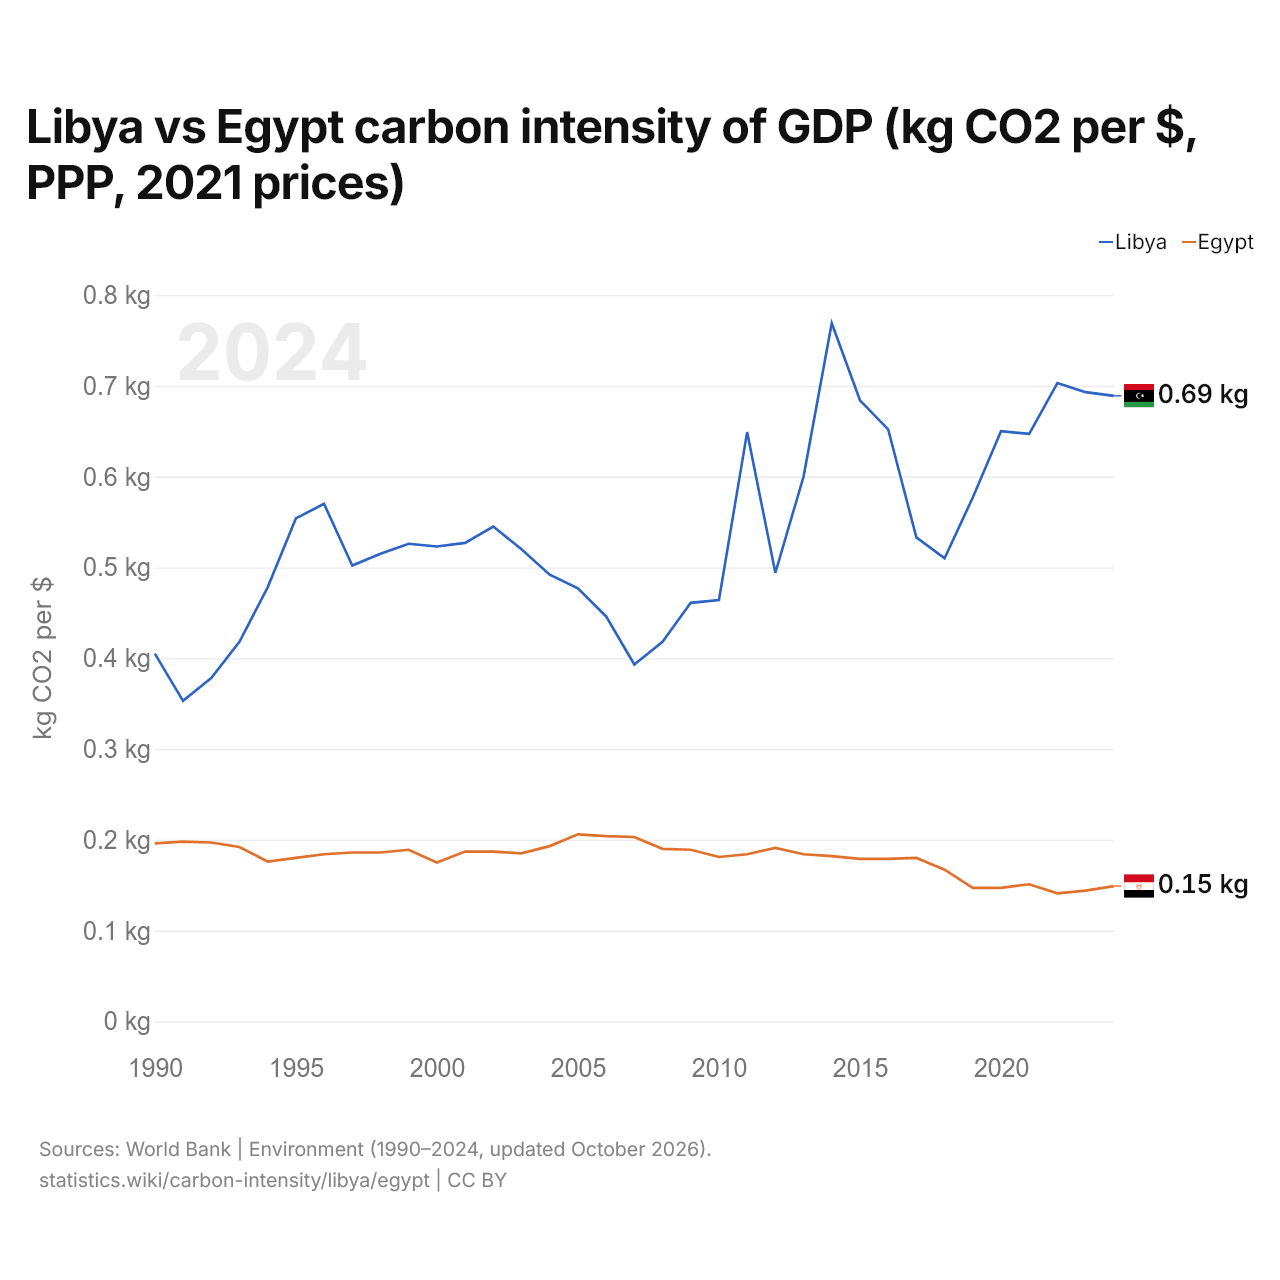
Carbon intensity is 0.689 kg of CO2 per dollar of GDP in Libya and 0.149 kg in Egypt: 0.540 kg more in Libya. In 1990, Libya emitted 0.405 kg and Egypt 0.196 kg, a difference of 0.209 kg.
Libya's carbon intensity has been higher than Egypt's every year since 1990. The gap was widest in 2014, when Libya's carbon intensity was 0.587 kg above Egypt's.
Libya vs Egypt: latest carbon intensity of GDP
Compare the carbon intensity of GDP of any 2 countries
Sources:
- World Bank | Environment (1990–2024, updated October 2026)
Creative Commons Attribution (CC BY): you may copy, share, adapt and reuse this content, also commercially, as long as you credit statistics.wiki and note any changes you made. The sources listed above may have their own license terms.