
Qatar carbon intensity of GDP (kg CO2 per $, PPP, 2021 prices)
| Year | kg CO2 per $ | World rank |
|---|---|---|
| 2024 | 0.425 kg | #9 |
| 2023 | 0.419 kg | #10 |
| 2022 | 0.394 kg | #11 |
| 2021 | 0.405 kg | #11 |
| 2020 | 0.401 kg | #13 |
| 2019 | 0.394 kg | #12 |
| 2018 | 0.387 kg | #14 |
| 2017 | 0.39 kg | #14 |
| 2016 | 0.384 kg | #15 |
| 2015 | 0.395 kg | #14 |
| 2014 | 0.402 kg | #15 |
| 2013 | 0.386 kg | #15 |
| 2012 | 0.364 kg | #18 |
| 2011 | 0.344 kg | #20 |
| 2010 | 0.337 kg | #21 |
| 2009 | 0.349 kg | #20 |
| 2008 | 0.377 kg | #16 |
| 2007 | 0.403 kg | #16 |
| 2006 | 0.415 kg | #17 |
| 2005 | 0.465 kg | #14 |
| 2004 | 0.473 kg | #12 |
| 2003 | 0.524 kg | #10 |
| 2002 | 0.514 kg | #12 |
| 2001 | 0.494 kg | #15 |
| 2000 | 0.502 kg | #14 |
| 1999 | 0.556 kg | #12 |
| 1998 | 0.535 kg | #13 |
| 1997 | 0.553 kg | #16 |
| 1996 | 0.587 kg | #17 |
| 1995 | 0.564 kg | #17 |
| 1994 | 0.565 kg | #19 |
| 1993 | 0.544 kg | #22 |
| 1992 | 0.523 kg | #25 |
| 1991 | 0.553 kg | #23 |
| 1990 | 0.512 kg | #24 |
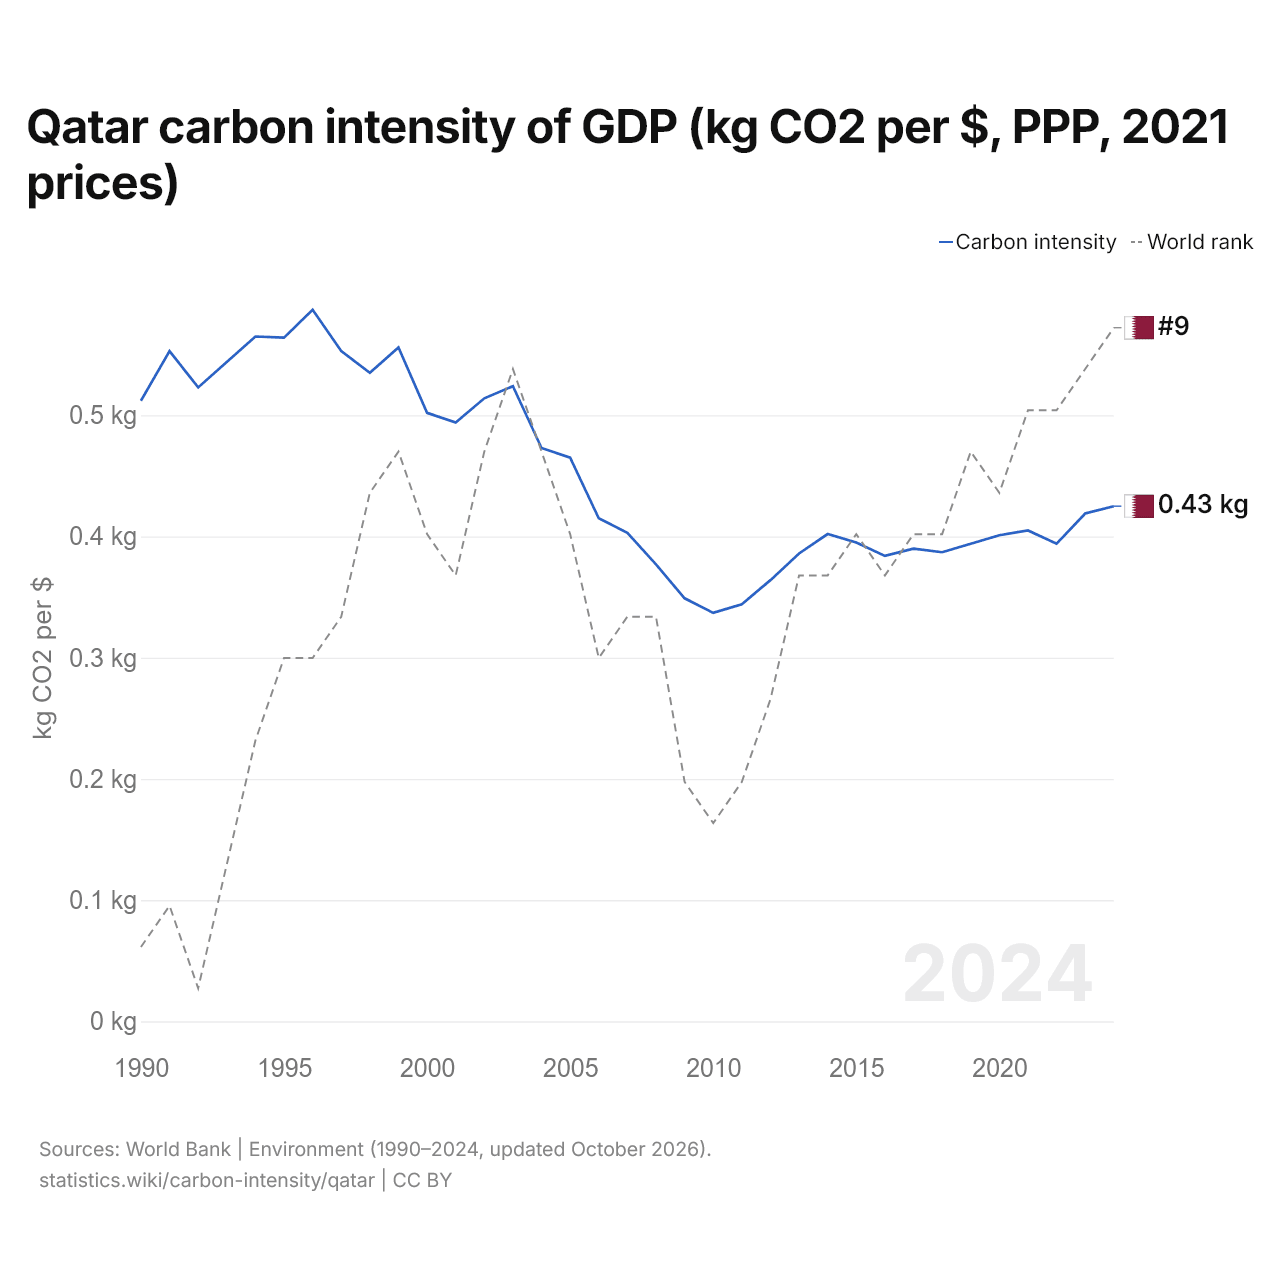
The carbon intensity of GDP in Qatar is 0.425 kg of CO2 per dollar, down from 0.512 kg in 1990. Qatar's is 1.9 times the world's 0.221 kg. Its carbon intensity was highest in 1996, at 0.587 kg. It is the 9th highest in the world, up from 10th the year before.
Qatar's carbon intensity is the 6th highest of 44 countries in Asia, where it ranges from Singapore's 0.072 kg to Turkmenistan's 0.588 kg. The largest ten-year fall in Qatar's carbon intensity was from 2000 to 2010, by 0.165 kg; the largest ten-year rise was from 2010 to 2020, by 0.064 kg.
Qatar in the world carbon intensity of GDP ranking
| Rank | Country | kg CO2 per $ | Change since 1990 | |
|---|---|---|---|---|
| 6 |
 Kuwait |
0.507 | +2.7% | vs Kuwait |
| 7 |
 South Africa |
0.506 | −29.1% | |
| 8 |
 Mongolia |
0.466 | −50.6% | |
| 9 |
 Qatar |
0.425 | −17.0% | |
| 10 |
 Iraq |
0.407 | +10.7% | vs Iraq |
| 11 |
 Bahrain |
0.405 | −27.3% | vs Bahrain |
| 12 |
 China |
0.391 | −69.4% |
Compare Qatar carbon intensity of GDP with other countries
Sources:
- World Bank | Environment (1990–2024, updated October 2026)
Creative Commons Attribution (CC BY): you may copy, share, adapt and reuse this content, also commercially, as long as you credit statistics.wiki and note any changes you made. The sources listed above may have their own license terms.