
Netherlands carbon intensity of GDP (kg CO2 per $, PPP, 2021 prices)
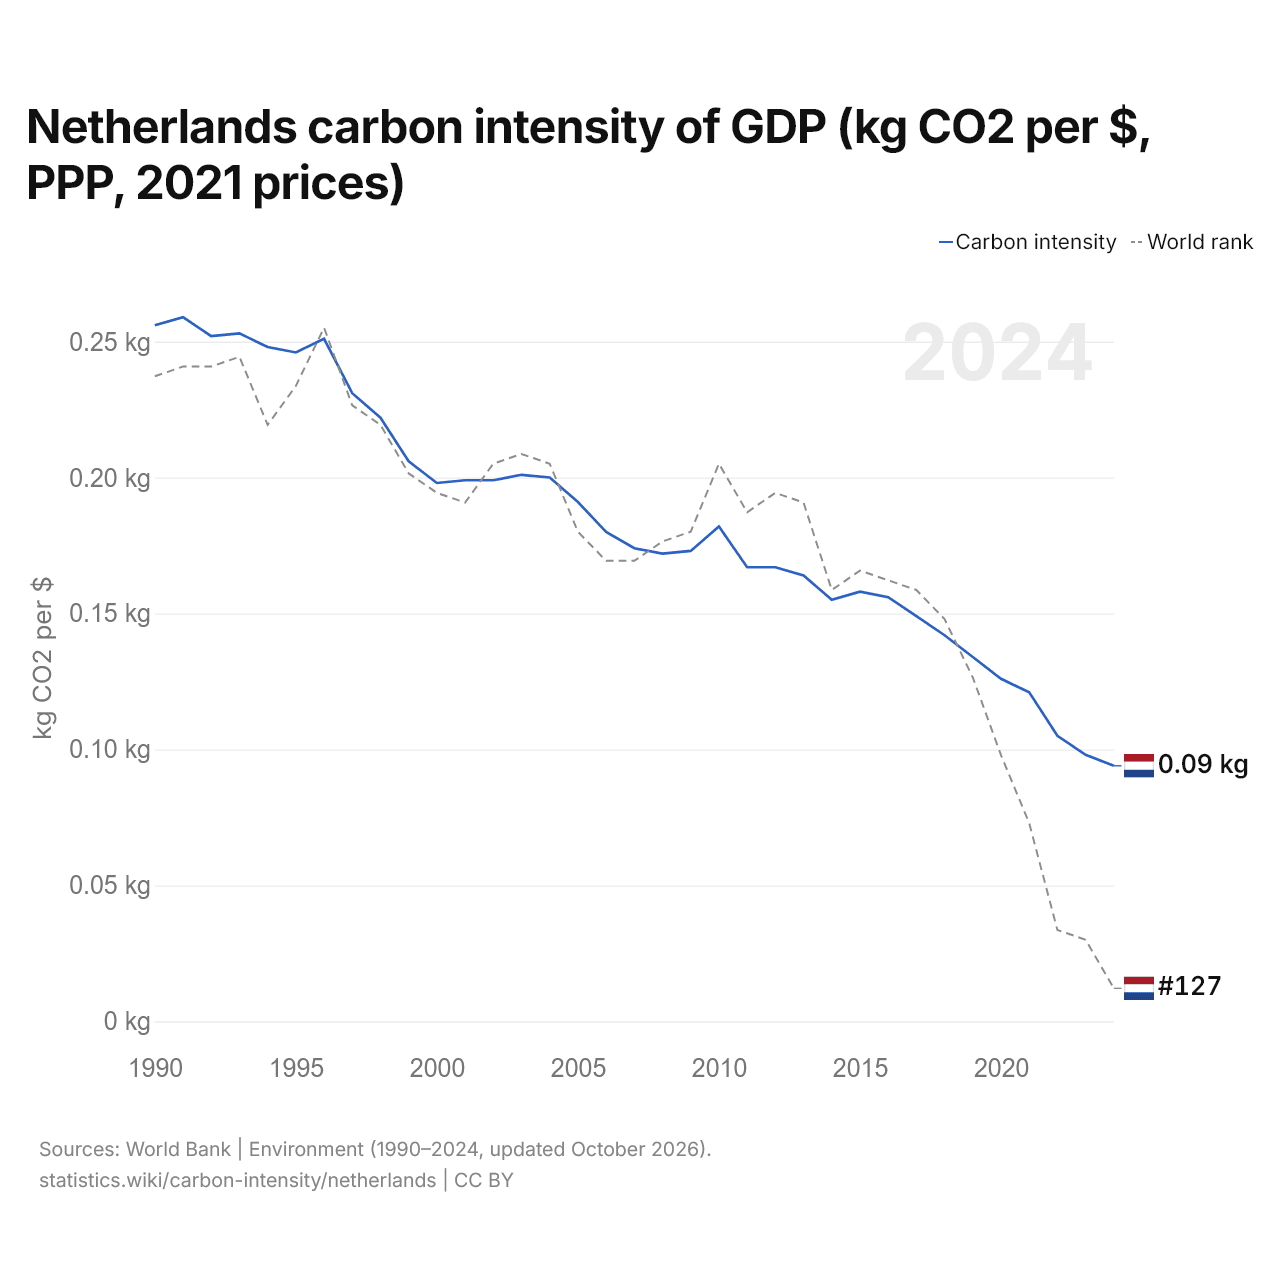
| Year | kg CO2 per $ | World rank |
|---|---|---|
| 2024 | 0.094 kg | #127 |
| 2023 | 0.098 kg | #122 |
| 2022 | 0.105 kg | #121 |
| 2021 | 0.121 kg | #110 |
| 2020 | 0.126 kg | #103 |
| 2019 | 0.134 kg | #95 |
| 2018 | 0.142 kg | #89 |
| 2017 | 0.149 kg | #86 |
| 2016 | 0.156 kg | #85 |
| 2015 | 0.158 kg | #84 |
| 2014 | 0.155 kg | #86 |
| 2013 | 0.164 kg | #77 |
| 2012 | 0.167 kg | #76 |
| 2011 | 0.167 kg | #78 |
| 2010 | 0.182 kg | #73 |
| 2009 | 0.173 kg | #80 |
| 2008 | 0.172 kg | #81 |
| 2007 | 0.174 kg | #83 |
| 2006 | 0.18 kg | #83 |
| 2005 | 0.191 kg | #80 |
| 2004 | 0.2 kg | #73 |
| 2003 | 0.201 kg | #72 |
| 2002 | 0.199 kg | #73 |
| 2001 | 0.199 kg | #77 |
| 2000 | 0.198 kg | #76 |
| 1999 | 0.206 kg | #74 |
| 1998 | 0.222 kg | #69 |
| 1997 | 0.231 kg | #67 |
| 1996 | 0.251 kg | #59 |
| 1995 | 0.246 kg | #65 |
| 1994 | 0.248 kg | #69 |
| 1993 | 0.253 kg | #62 |
| 1992 | 0.252 kg | #63 |
| 1991 | 0.259 kg | #63 |
| 1990 | 0.256 kg | #64 |
The carbon intensity of GDP in the Netherlands is 0.094 kg of CO2 per dollar, down from 0.256 kg in 1990. The Netherlands' is 42% of the world's 0.221 kg. Its carbon intensity was highest in 1991, at 0.259 kg. It is the 127th highest in the world, down from 122nd the year before. Its highest rank was 59th, last held in 1996.
The Netherlands' carbon intensity is the 25th highest of 38 countries in Europe, where it ranges from Switzerland's 0.044 kg to Russia's 0.328 kg. The largest ten-year fall in the Netherlands' carbon intensity was from 1990 to 2000, by 0.058 kg.
Netherlands in the world carbon intensity of GDP ranking
| Rank | Country | kg CO2 per $ | Change since 1990 | |
|---|---|---|---|---|
| 124 |
 Lithuania |
0.095 | −79.5% | vs Lithuania |
| 125 |
 Saint Kitts |
0.094 | +162% | |
| 126 |
 Liberia |
0.094 | +3.8% | |
| 127 |
 Netherlands |
0.094 | −63.4% | |
| 128 |
 Togo |
0.093 | +10.5% | |
| 129 |
 Spain |
0.093 | −50.0% | vs Spain |
| 130 |
 Romania |
0.092 | −81.5% | vs Romania |
Compare Netherlands carbon intensity of GDP with other countries
Sources:
- World Bank | Environment (1990–2024, updated October 2026)
Creative Commons Attribution (CC BY): you may copy, share, adapt and reuse this content, also commercially, as long as you credit statistics.wiki and note any changes you made. The sources listed above may have their own license terms.