
Nepal carbon intensity of GDP (kg CO2 per $, PPP, 2021 prices)
| Year | kg CO2 per $ | World rank |
|---|---|---|
| 2024 | 0.106 kg | #115 |
| 2023 | 0.107 kg | #114 |
| 2022 | 0.106 kg | #119 |
| 2021 | 0.13 kg | #103 |
| 2020 | 0.129 kg | #100 |
| 2019 | 0.103 kg | #127 |
| 2018 | 0.122 kg | #112 |
| 2017 | 0.116 kg | #119 |
| 2016 | 0.103 kg | #126 |
| 2015 | 0.07 kg | #159 |
| 2014 | 0.073 kg | #152 |
| 2013 | 0.067 kg | #160 |
| 2012 | 0.068 kg | #156 |
| 2011 | 0.061 kg | #159 |
| 2010 | 0.057 kg | #164 |
| 2009 | 0.05 kg | #166 |
| 2008 | 0.04 kg | #172 |
| 2007 | 0.038 kg | #173 |
| 2006 | 0.039 kg | #170 |
| 2005 | 0.048 kg | #163 |
| 2004 | 0.045 kg | #167 |
| 2003 | 0.054 kg | #163 |
| 2002 | 0.049 kg | #164 |
| 2001 | 0.061 kg | #156 |
| 2000 | 0.06 kg | #155 |
| 1999 | 0.062 kg | #154 |
| 1998 | 0.049 kg | #161 |
| 1997 | 0.048 kg | #162 |
| 1996 | 0.046 kg | #163 |
| 1995 | 0.045 kg | #160 |
| 1994 | 0.043 kg | #161 |
| 1993 | 0.038 kg | #161 |
| 1992 | 0.036 kg | #164 |
| 1991 | 0.036 kg | #164 |
| 1990 | 0.031 kg | #166 |
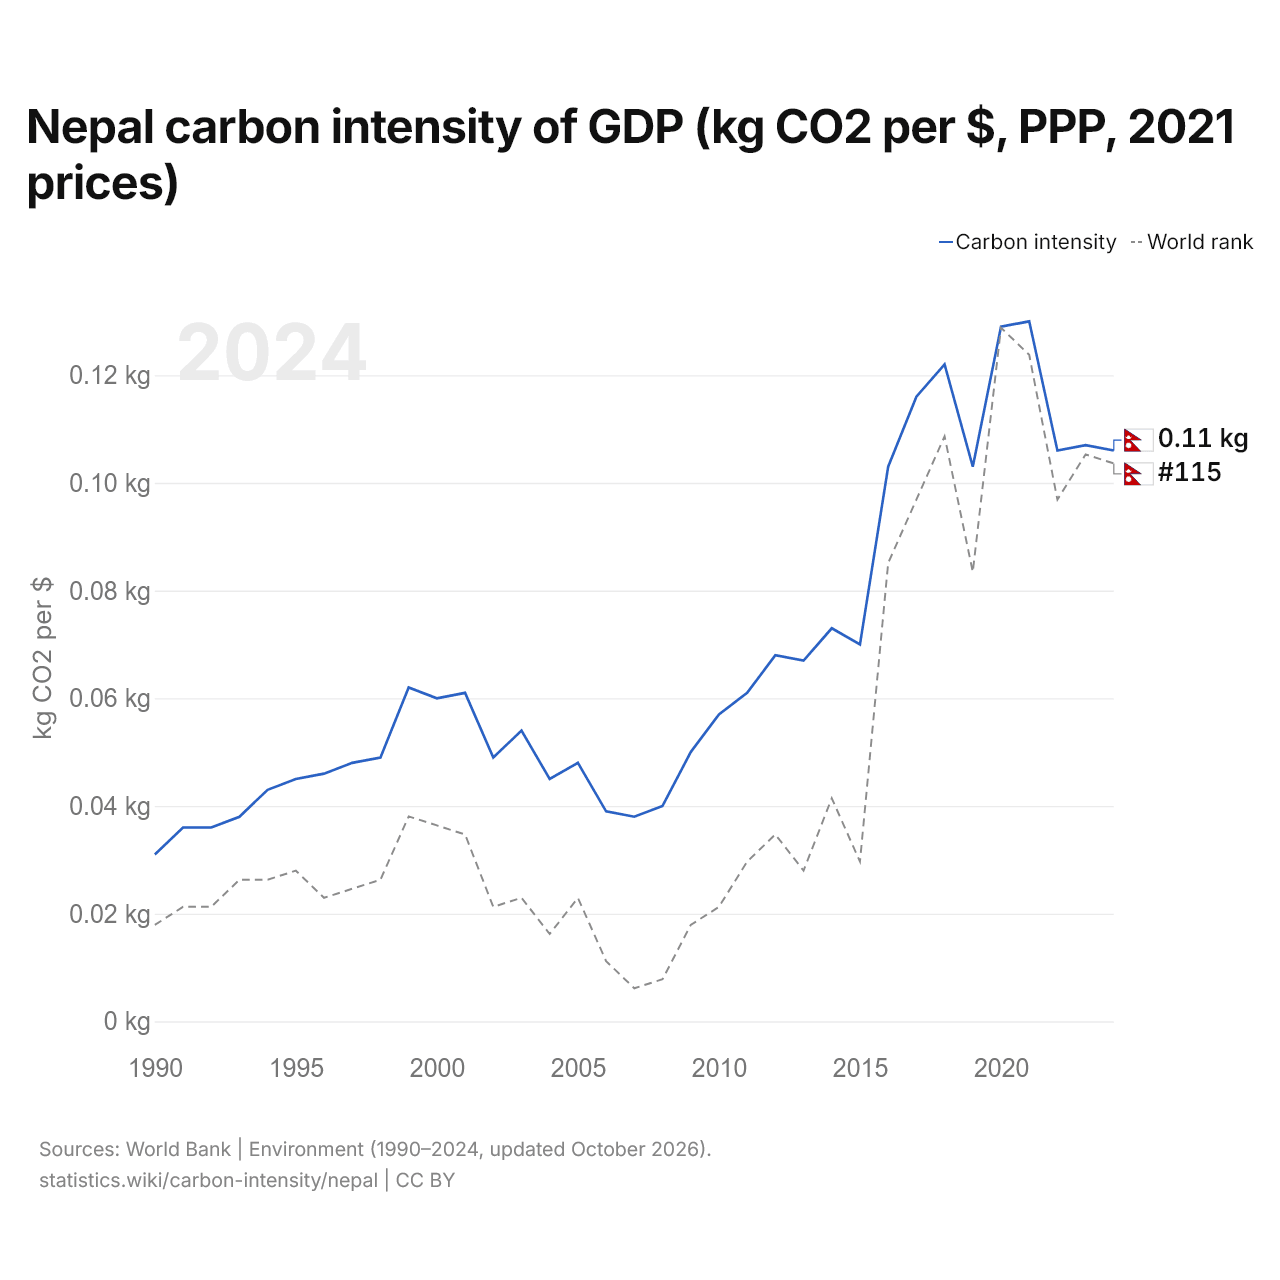
The carbon intensity of GDP in Nepal is 0.106 kg of CO2 per dollar, up from 0.031 kg in 1990. Nepal's is 48% of the world's 0.221 kg. Its carbon intensity was highest in 2021, at 0.130 kg. It is the 115th highest in the world, down from 114th the year before. Its highest rank was 100th, last held in 2020.
Nepal's carbon intensity is the 41st highest of 44 countries in Asia, where it ranges from Singapore's 0.072 kg to Turkmenistan's 0.588 kg. The largest ten-year rise in Nepal's carbon intensity was from 2010 to 2020, by 0.072 kg.
Nepal in the world carbon intensity of GDP ranking







Compare Nepal carbon intensity of GDP with other countries
Sources:
- World Bank | Environment (1990–2024, updated October 2026)
Creative Commons Attribution (CC BY): you may copy, share, adapt and reuse this content, also commercially, as long as you credit statistics.wiki and note any changes you made. The sources listed above may have their own license terms.