
Kyrgyzstan carbon intensity of GDP (kg CO2 per $, PPP, 2021 prices)
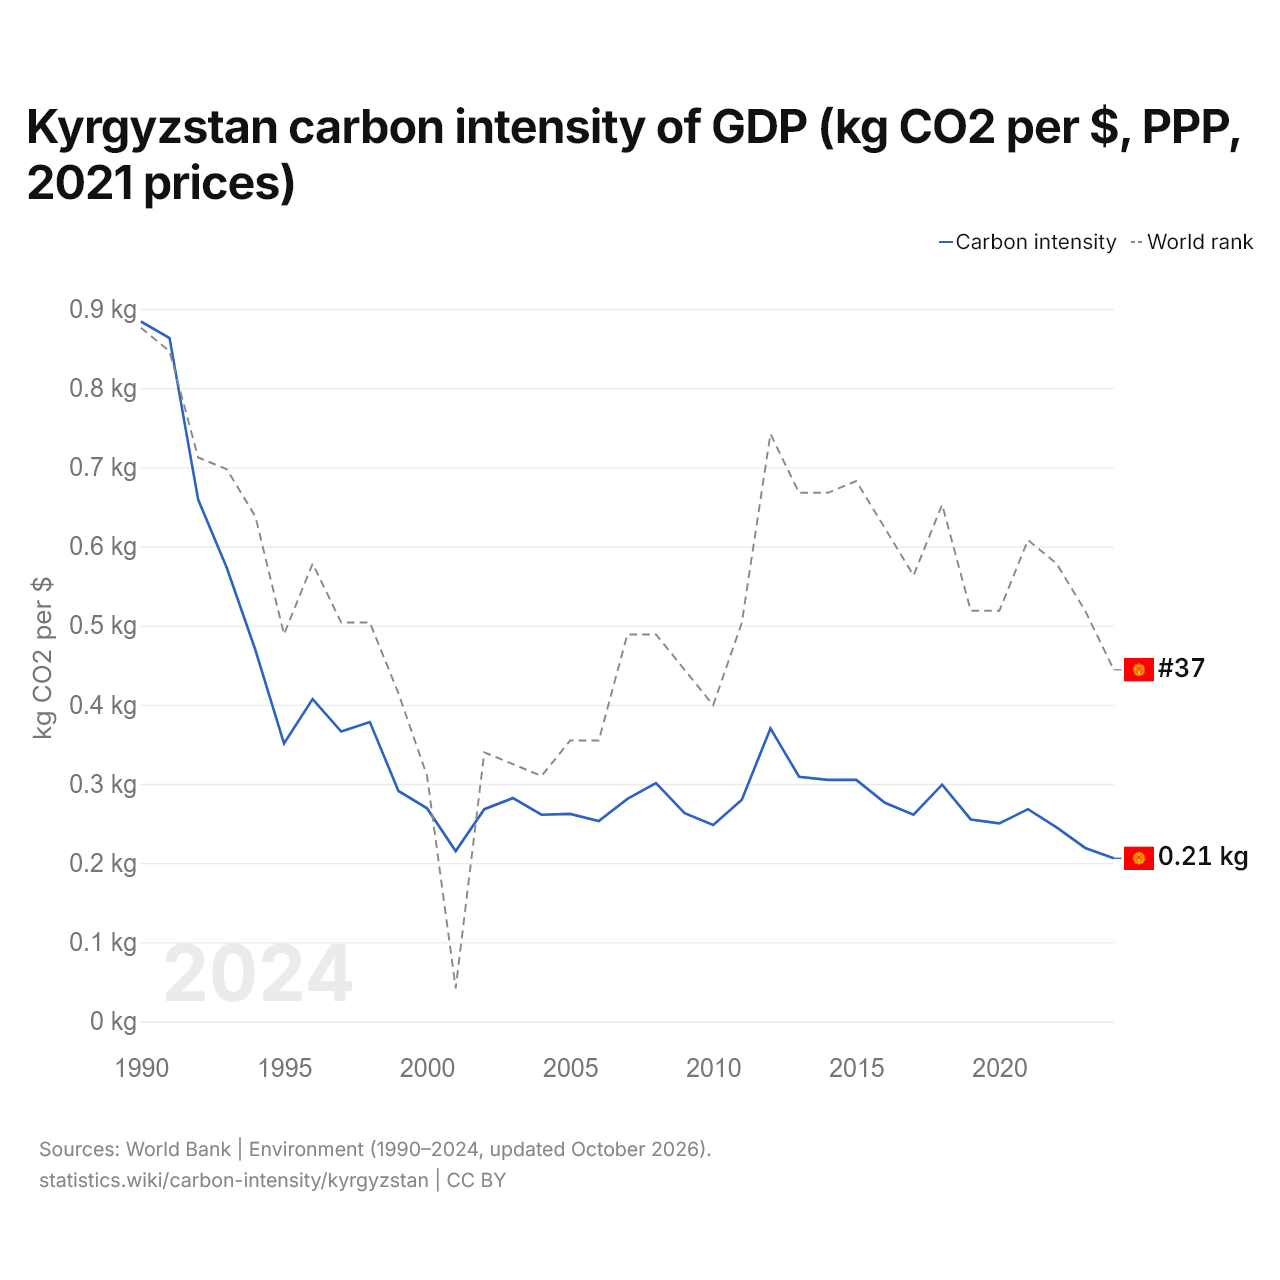
| Year | kg CO2 per $ | World rank |
|---|---|---|
| 2024 | 0.206 kg | #37 |
| 2023 | 0.219 kg | #32 |
| 2022 | 0.245 kg | #28 |
| 2021 | 0.268 kg | #26 |
| 2020 | 0.25 kg | #32 |
| 2019 | 0.255 kg | #32 |
| 2018 | 0.299 kg | #23 |
| 2017 | 0.261 kg | #29 |
| 2016 | 0.276 kg | #25 |
| 2015 | 0.305 kg | #21 |
| 2014 | 0.305 kg | #22 |
| 2013 | 0.309 kg | #22 |
| 2012 | 0.37 kg | #17 |
| 2011 | 0.28 kg | #33 |
| 2010 | 0.248 kg | #40 |
| 2009 | 0.263 kg | #37 |
| 2008 | 0.301 kg | #34 |
| 2007 | 0.281 kg | #34 |
| 2006 | 0.253 kg | #43 |
| 2005 | 0.262 kg | #43 |
| 2004 | 0.261 kg | #46 |
| 2003 | 0.282 kg | #45 |
| 2002 | 0.268 kg | #44 |
| 2001 | 0.215 kg | #64 |
| 2000 | 0.269 kg | #46 |
| 1999 | 0.291 kg | #39 |
| 1998 | 0.378 kg | #33 |
| 1997 | 0.366 kg | #33 |
| 1996 | 0.407 kg | #28 |
| 1995 | 0.351 kg | #34 |
| 1994 | 0.469 kg | #24 |
| 1993 | 0.573 kg | #20 |
| 1992 | 0.659 kg | #19 |
| 1991 | 0.863 kg | #10 |
| 1990 | 0.884 kg | #8 |
The carbon intensity of GDP in Kyrgyzstan is 0.206 kg of CO2 per dollar, down from 0.884 kg in 1990. Kyrgyzstan's is close to the world's 0.221 kg. It is the 37th highest in the world, down from 32nd the year before. Its highest rank was 8th, last held in 1990.
Kyrgyzstan's carbon intensity is the 20th highest of 44 countries in Asia, where it ranges from Singapore's 0.072 kg to Turkmenistan's 0.588 kg. The largest ten-year fall in Kyrgyzstan's carbon intensity was from 1990 to 2000, by 0.615 kg.
Kyrgyzstan in the world carbon intensity of GDP ranking







Compare Kyrgyzstan carbon intensity of GDP with other countries
Sources:
- World Bank | Environment (1990–2024, updated October 2026)
Creative Commons Attribution (CC BY): you may copy, share, adapt and reuse this content, also commercially, as long as you credit statistics.wiki and note any changes you made. The sources listed above may have their own license terms.