
Sweden carbon intensity of GDP (kg CO2 per $, PPP, 2021 prices)
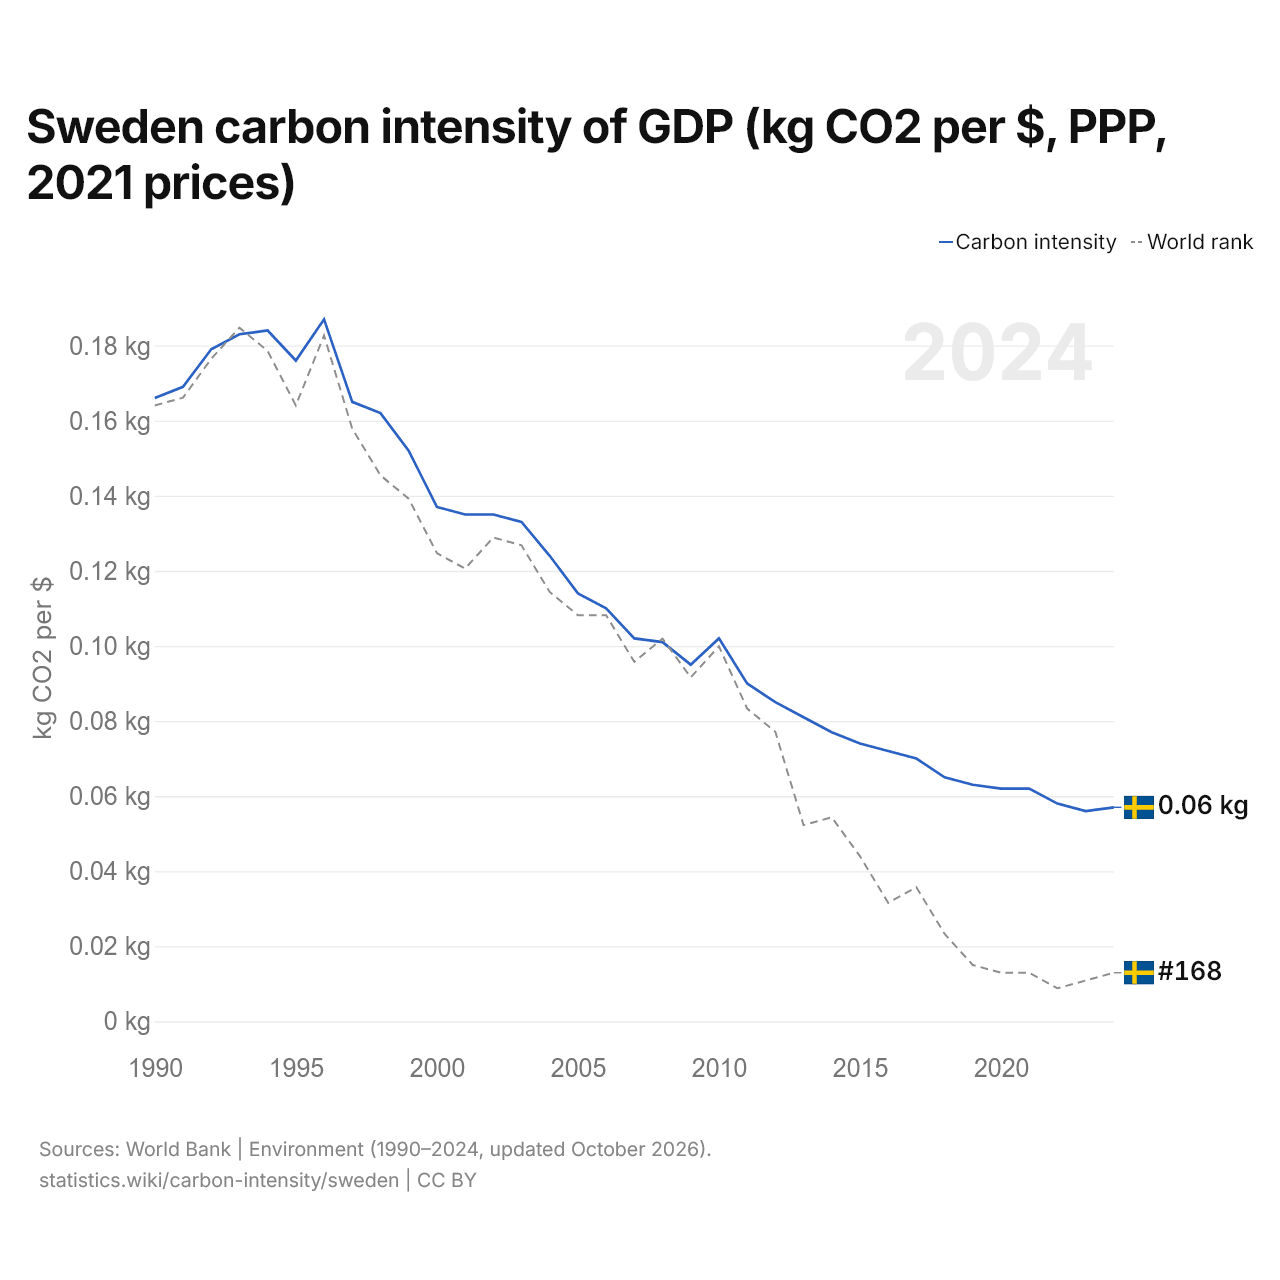
| Year | kg CO2 per $ | World rank |
|---|---|---|
| 2024 | 0.057 kg | #168 |
| 2023 | 0.056 kg | #169 |
| 2022 | 0.058 kg | #170 |
| 2021 | 0.062 kg | #168 |
| 2020 | 0.062 kg | #168 |
| 2019 | 0.063 kg | #167 |
| 2018 | 0.065 kg | #163 |
| 2017 | 0.07 kg | #157 |
| 2016 | 0.072 kg | #159 |
| 2015 | 0.074 kg | #153 |
| 2014 | 0.077 kg | #148 |
| 2013 | 0.081 kg | #149 |
| 2012 | 0.085 kg | #137 |
| 2011 | 0.09 kg | #134 |
| 2010 | 0.102 kg | #126 |
| 2009 | 0.095 kg | #130 |
| 2008 | 0.101 kg | #125 |
| 2007 | 0.102 kg | #128 |
| 2006 | 0.11 kg | #122 |
| 2005 | 0.114 kg | #122 |
| 2004 | 0.124 kg | #119 |
| 2003 | 0.133 kg | #113 |
| 2002 | 0.135 kg | #112 |
| 2001 | 0.135 kg | #116 |
| 2000 | 0.137 kg | #114 |
| 1999 | 0.152 kg | #107 |
| 1998 | 0.162 kg | #104 |
| 1997 | 0.165 kg | #98 |
| 1996 | 0.187 kg | #86 |
| 1995 | 0.176 kg | #95 |
| 1994 | 0.184 kg | #88 |
| 1993 | 0.183 kg | #85 |
| 1992 | 0.179 kg | #89 |
| 1991 | 0.169 kg | #94 |
| 1990 | 0.166 kg | #95 |
The carbon intensity of GDP in Sweden is 0.057 kg of CO2 per dollar, down from 0.166 kg in 1990. Sweden's is 26% of the world's 0.221 kg. Its carbon intensity was highest in 1996, at 0.187 kg. It is the 168th highest in the world, up from 169th the year before. Its highest rank was 85th, last held in 1993.
Sweden's carbon intensity is the 35th highest of 38 countries in Europe, where it ranges from Switzerland's 0.044 kg to Russia's 0.328 kg. The largest ten-year fall in Sweden's carbon intensity was from 2010 to 2020, by 0.040 kg.
Sweden in the world carbon intensity of GDP ranking
| Rank | Country | kg CO2 per $ | Change since 1990 | |
|---|---|---|---|---|
| 165 |
 Gambia |
0.058 | +33.2% | |
| 166 |
 Uganda |
0.057 | +30.9% | |
| 167 |
 Guinea-Bissau |
0.057 | −35.1% | |
| 168 |
 Sweden |
0.057 | −65.6% | |
| 169 |
 CAR |
0.057 | +52.1% | |
| 170 |
 Sierra Leone |
0.055 | −2.2% | |
| 171 |
 Malta |
0.051 | −85.9% | vs Malta |
Compare Sweden carbon intensity of GDP with other countries
Sources:
- World Bank | Environment (1990–2024, updated October 2026)
Creative Commons Attribution (CC BY): you may copy, share, adapt and reuse this content, also commercially, as long as you credit statistics.wiki and note any changes you made. The sources listed above may have their own license terms.