
Iraq carbon intensity of GDP (kg CO2 per $, PPP, 2021 prices)
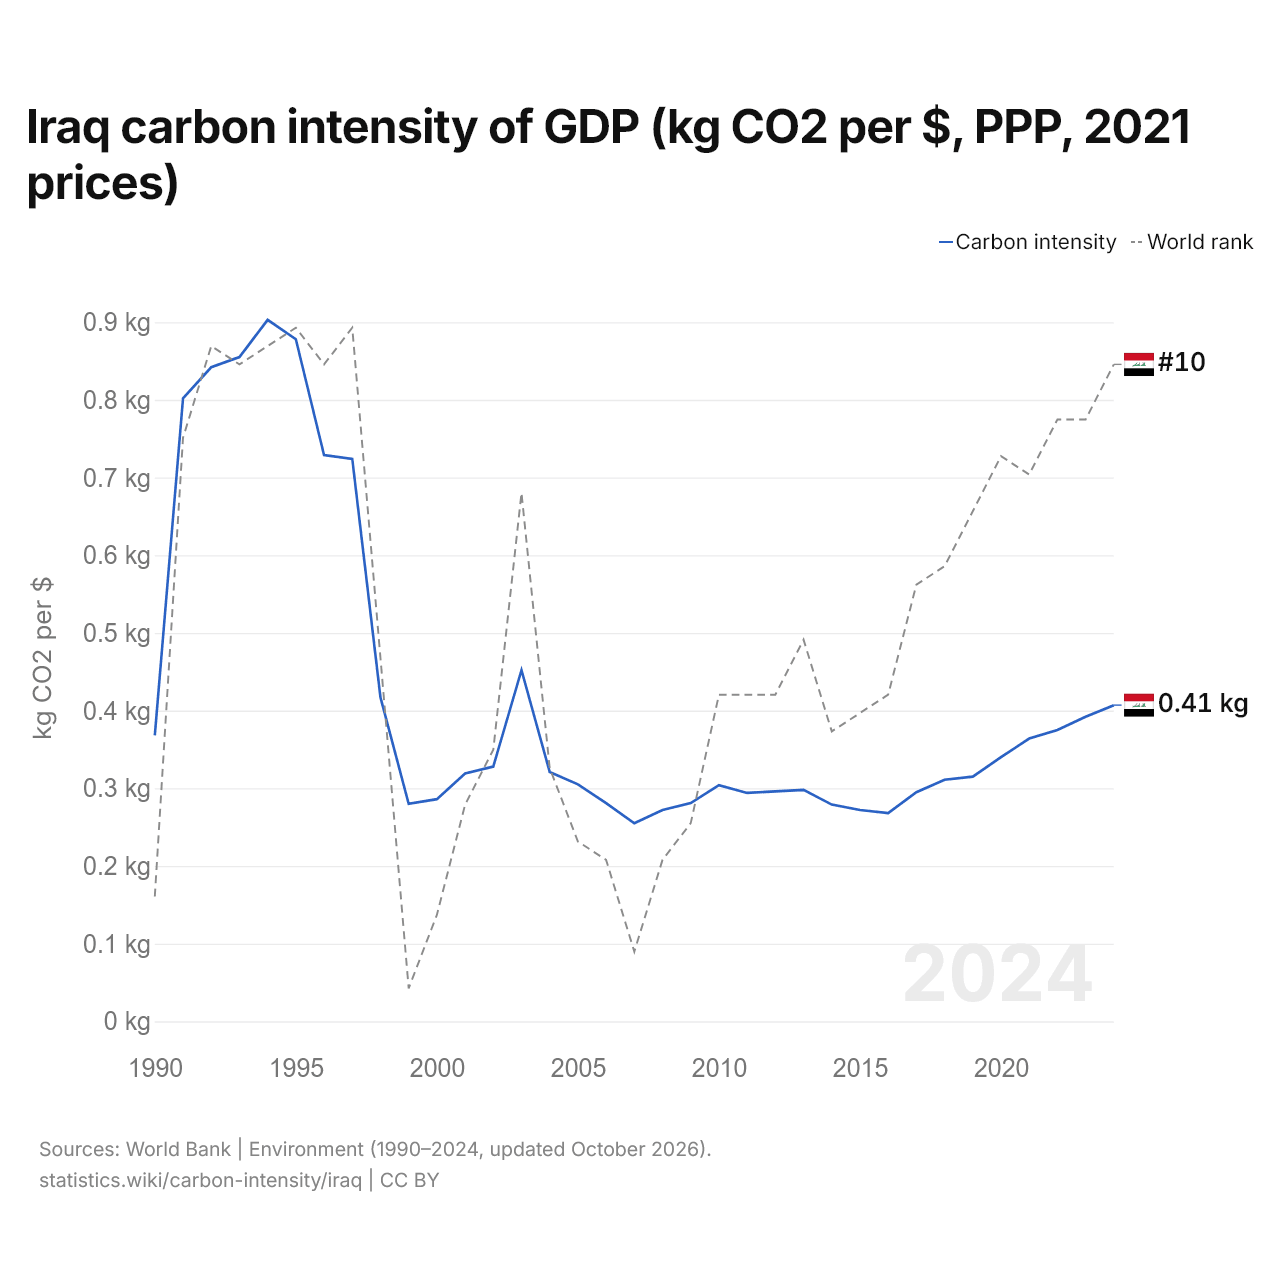
| Year | kg CO2 per $ | World rank |
|---|---|---|
| 2024 | 0.407 kg | #10 |
| 2023 | 0.392 kg | #13 |
| 2022 | 0.375 kg | #13 |
| 2021 | 0.364 kg | #16 |
| 2020 | 0.34 kg | #15 |
| 2019 | 0.315 kg | #18 |
| 2018 | 0.311 kg | #21 |
| 2017 | 0.295 kg | #22 |
| 2016 | 0.268 kg | #28 |
| 2015 | 0.272 kg | #29 |
| 2014 | 0.279 kg | #30 |
| 2013 | 0.298 kg | #25 |
| 2012 | 0.296 kg | #28 |
| 2011 | 0.294 kg | #28 |
| 2010 | 0.304 kg | #28 |
| 2009 | 0.281 kg | #35 |
| 2008 | 0.272 kg | #37 |
| 2007 | 0.255 kg | #42 |
| 2006 | 0.281 kg | #37 |
| 2005 | 0.305 kg | #36 |
| 2004 | 0.321 kg | #32 |
| 2003 | 0.452 kg | #17 |
| 2002 | 0.328 kg | #31 |
| 2001 | 0.319 kg | #34 |
| 2000 | 0.286 kg | #40 |
| 1999 | 0.28 kg | #44 |
| 1998 | 0.417 kg | #26 |
| 1997 | 0.724 kg | #8 |
| 1996 | 0.729 kg | #10 |
| 1995 | 0.878 kg | #8 |
| 1994 | 0.903 kg | #9 |
| 1993 | 0.855 kg | #10 |
| 1992 | 0.842 kg | #9 |
| 1991 | 0.802 kg | #14 |
| 1990 | 0.368 kg | #39 |
The carbon intensity of GDP in Iraq is 0.407 kg of CO2 per dollar, up from 0.368 kg in 1990. Iraq's is 1.8 times the world's 0.221 kg. Its carbon intensity was highest in 1994, at 0.903 kg. It is the 10th highest in the world, up from 13th the year before. Its highest rank was 8th, last held in 1997.
Iraq's carbon intensity is the 7th highest of 44 countries in Asia, where it ranges from Singapore's 0.072 kg to Turkmenistan's 0.588 kg. The largest ten-year rise in Iraq's carbon intensity was from 2010 to 2020, by 0.036 kg; the largest ten-year fall was from 1990 to 2000, by 0.082 kg.
Iraq in the world carbon intensity of GDP ranking







Compare Iraq carbon intensity of GDP with other countries
Sources:
- World Bank | Environment (1990–2024, updated October 2026)
Creative Commons Attribution (CC BY): you may copy, share, adapt and reuse this content, also commercially, as long as you credit statistics.wiki and note any changes you made. The sources listed above may have their own license terms.