
Qatar vs India carbon intensity of GDP (kg CO2 per $, PPP, 2021 prices)
1x
| Year | kg CO2 per $ | |
|---|---|---|
 Qatar |
 India |
|
| 2024 | 0.425 kg | 0.231 kg |
| 2023 | 0.419 kg | 0.236 kg |
| 2022 | 0.394 kg | 0.236 kg |
| 2021 | 0.405 kg | 0.235 kg |
| 2020 | 0.401 kg | 0.234 kg |
| 2019 | 0.394 kg | 0.238 kg |
| 2018 | 0.387 kg | 0.248 kg |
| 2017 | 0.39 kg | 0.252 kg |
| 2016 | 0.384 kg | 0.255 kg |
| 2015 | 0.395 kg | 0.272 kg |
| 2014 | 0.402 kg | 0.289 kg |
| 2013 | 0.386 kg | 0.287 kg |
| 2012 | 0.364 kg | 0.297 kg |
| 2011 | 0.344 kg | 0.287 kg |
| 2010 | 0.337 kg | 0.283 kg |
| 2009 | 0.349 kg | 0.288 kg |
| 2008 | 0.377 kg | 0.291 kg |
| 2007 | 0.403 kg | 0.279 kg |
| 2006 | 0.415 kg | 0.276 kg |
| 2005 | 0.465 kg | 0.28 kg |
| 2004 | 0.473 kg | 0.29 kg |
| 2003 | 0.524 kg | 0.29 kg |
| 2002 | 0.514 kg | 0.303 kg |
| 2001 | 0.494 kg | 0.303 kg |
| 2000 | 0.502 kg | 0.313 kg |
| 1999 | 0.556 kg | 0.314 kg |
| 1998 | 0.535 kg | 0.32 kg |
| 1997 | 0.553 kg | 0.331 kg |
| 1996 | 0.587 kg | 0.327 kg |
| 1995 | 0.564 kg | 0.336 kg |
| 1994 | 0.565 kg | 0.337 kg |
| 1993 | 0.544 kg | 0.339 kg |
| 1992 | 0.523 kg | 0.339 kg |
| 1991 | 0.553 kg | 0.346 kg |
| 1990 | 0.512 kg | 0.325 kg |
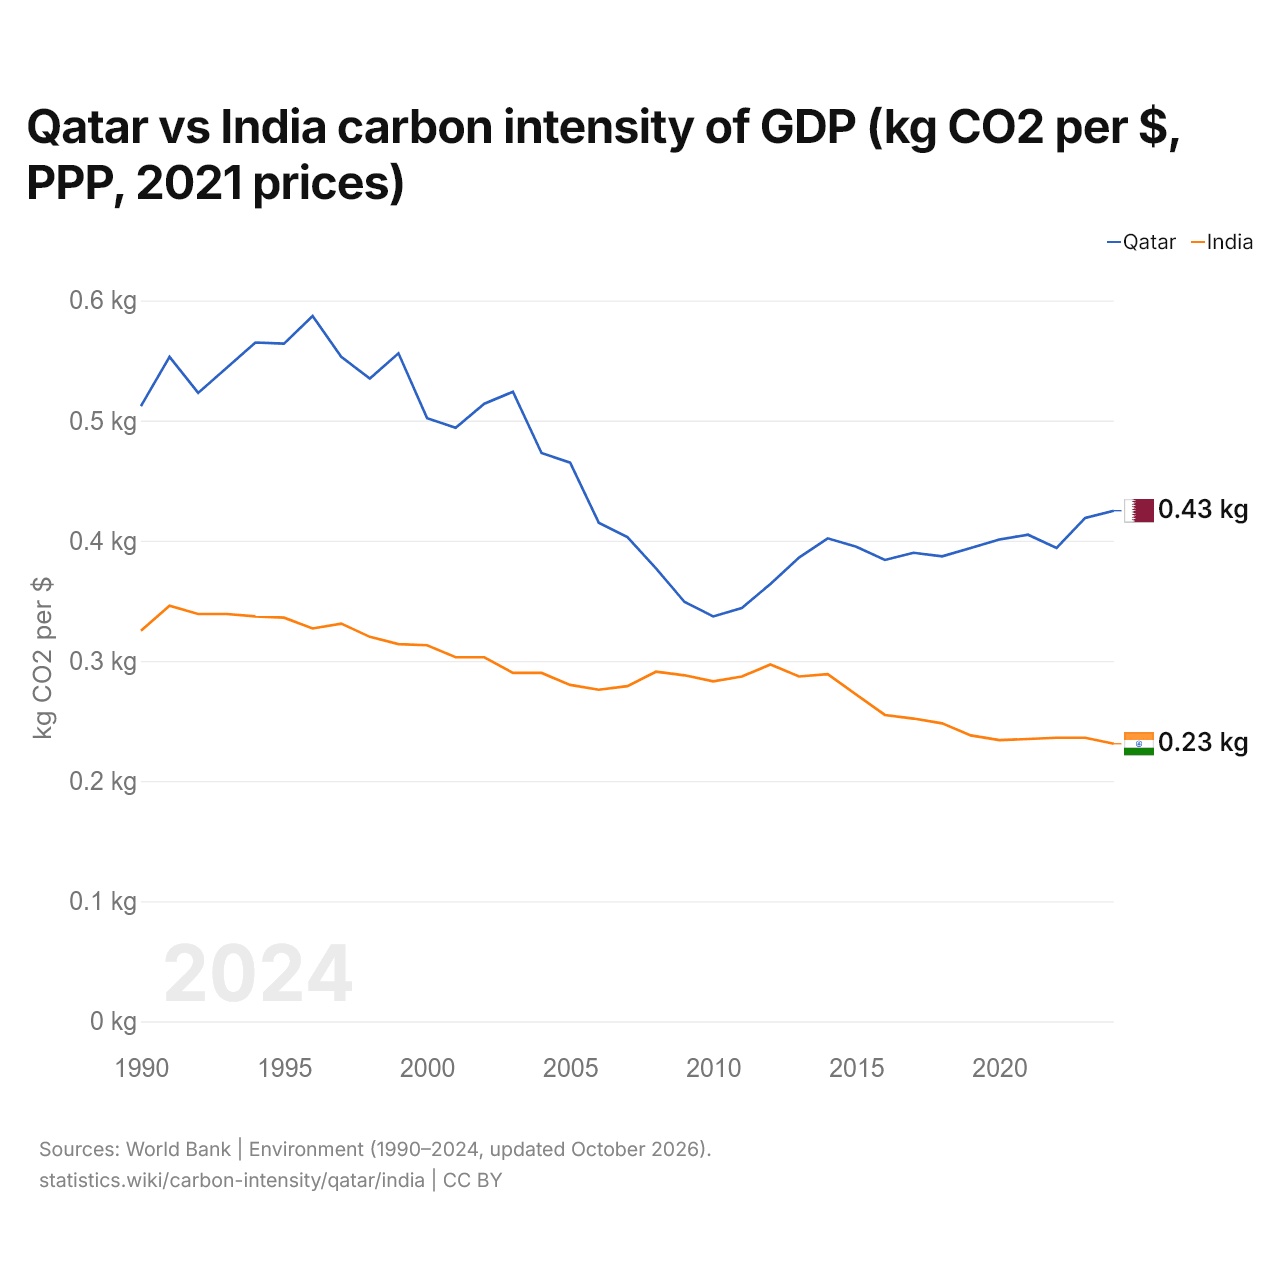
Carbon intensity is 0.425 kg of CO2 per dollar of GDP in Qatar and 0.231 kg in India: 0.194 kg more in Qatar. In 1990, Qatar emitted 0.512 kg and India 0.325 kg, a difference of 0.187 kg.
Qatar's carbon intensity has been higher than India's every year since 1990. The gap was widest in 1996, when Qatar's carbon intensity was 0.260 kg above India's.
Qatar vs India: latest carbon intensity of GDP
Compare the carbon intensity of GDP of any 2 countries
Sources:
- World Bank | Environment (1990–2024, updated October 2026)
Creative Commons Attribution (CC BY): you may copy, share, adapt and reuse this content, also commercially, as long as you credit statistics.wiki and note any changes you made. The sources listed above may have their own license terms.