
Turkey vs India carbon intensity of GDP (kg CO2 per $, PPP, 2021 prices)
1x
| Year | kg CO2 per $ | |
|---|---|---|
 Turkey |
 India |
|
| 2024 | 0.149 kg | 0.231 kg |
| 2023 | 0.149 kg | 0.236 kg |
| 2022 | 0.156 kg | 0.236 kg |
| 2021 | 0.171 kg | 0.235 kg |
| 2020 | 0.175 kg | 0.234 kg |
| 2019 | 0.175 kg | 0.238 kg |
| 2018 | 0.183 kg | 0.248 kg |
| 2017 | 0.191 kg | 0.252 kg |
| 2016 | 0.186 kg | 0.255 kg |
| 2015 | 0.181 kg | 0.272 kg |
| 2014 | 0.185 kg | 0.289 kg |
| 2013 | 0.182 kg | 0.287 kg |
| 2012 | 0.203 kg | 0.297 kg |
| 2011 | 0.206 kg | 0.287 kg |
| 2010 | 0.215 kg | 0.283 kg |
| 2009 | 0.225 kg | 0.288 kg |
| 2008 | 0.213 kg | 0.291 kg |
| 2007 | 0.215 kg | 0.279 kg |
| 2006 | 0.206 kg | 0.276 kg |
| 2005 | 0.198 kg | 0.28 kg |
| 2004 | 0.207 kg | 0.29 kg |
| 2003 | 0.222 kg | 0.29 kg |
| 2002 | 0.222 kg | 0.303 kg |
| 2001 | 0.225 kg | 0.303 kg |
| 2000 | 0.234 kg | 0.313 kg |
| 1999 | 0.225 kg | 0.314 kg |
| 1998 | 0.22 kg | 0.32 kg |
| 1997 | 0.222 kg | 0.331 kg |
| 1996 | 0.227 kg | 0.327 kg |
| 1995 | 0.223 kg | 0.336 kg |
| 1994 | 0.221 kg | 0.337 kg |
| 1993 | 0.212 kg | 0.339 kg |
| 1992 | 0.22 kg | 0.339 kg |
| 1991 | 0.222 kg | 0.346 kg |
| 1990 | 0.227 kg | 0.325 kg |
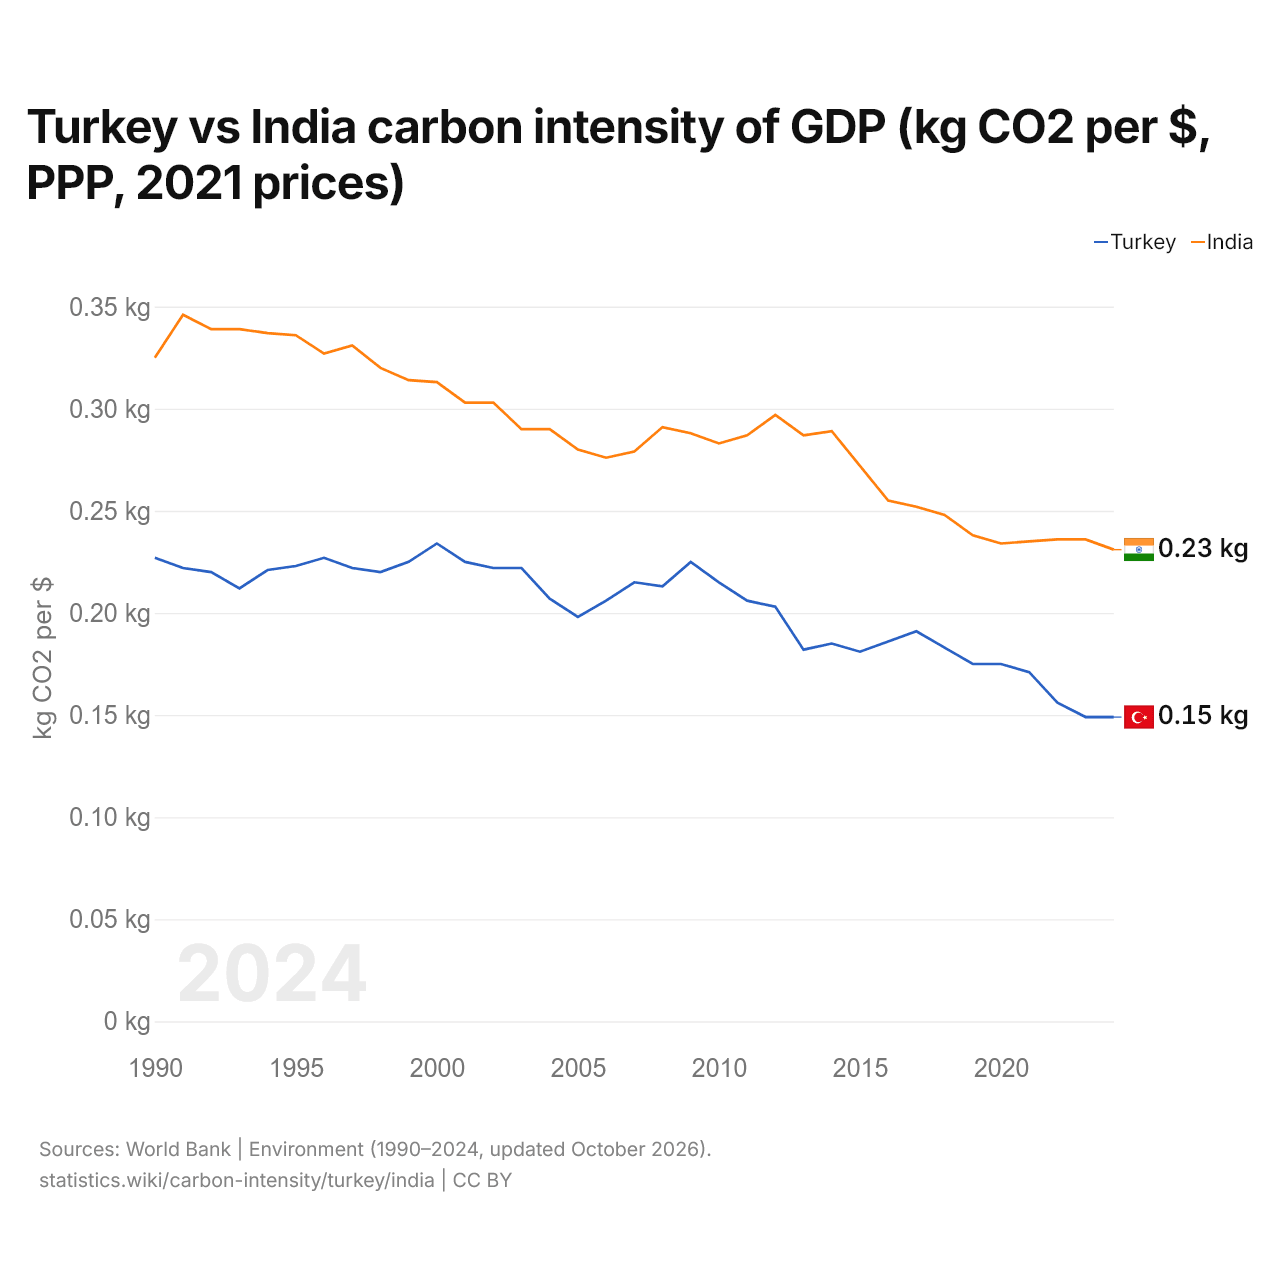
Carbon intensity is 0.149 kg of CO2 per dollar of GDP in Turkey and 0.231 kg in India: 0.082 kg more in India. In 1990, Turkey emitted 0.227 kg and India 0.325 kg, a difference of 0.098 kg.
India's carbon intensity has been higher than Turkey's every year since 1990. The gap was widest in 1993, when India's carbon intensity was 0.127 kg above Turkey's.
Turkey vs India: latest carbon intensity of GDP
Compare the carbon intensity of GDP of any 2 countries
Sources:
- World Bank | Environment (1990–2024, updated October 2026)
Creative Commons Attribution (CC BY): you may copy, share, adapt and reuse this content, also commercially, as long as you credit statistics.wiki and note any changes you made. The sources listed above may have their own license terms.