
Tonga carbon intensity of GDP (kg CO2 per $, PPP, 2021 prices)
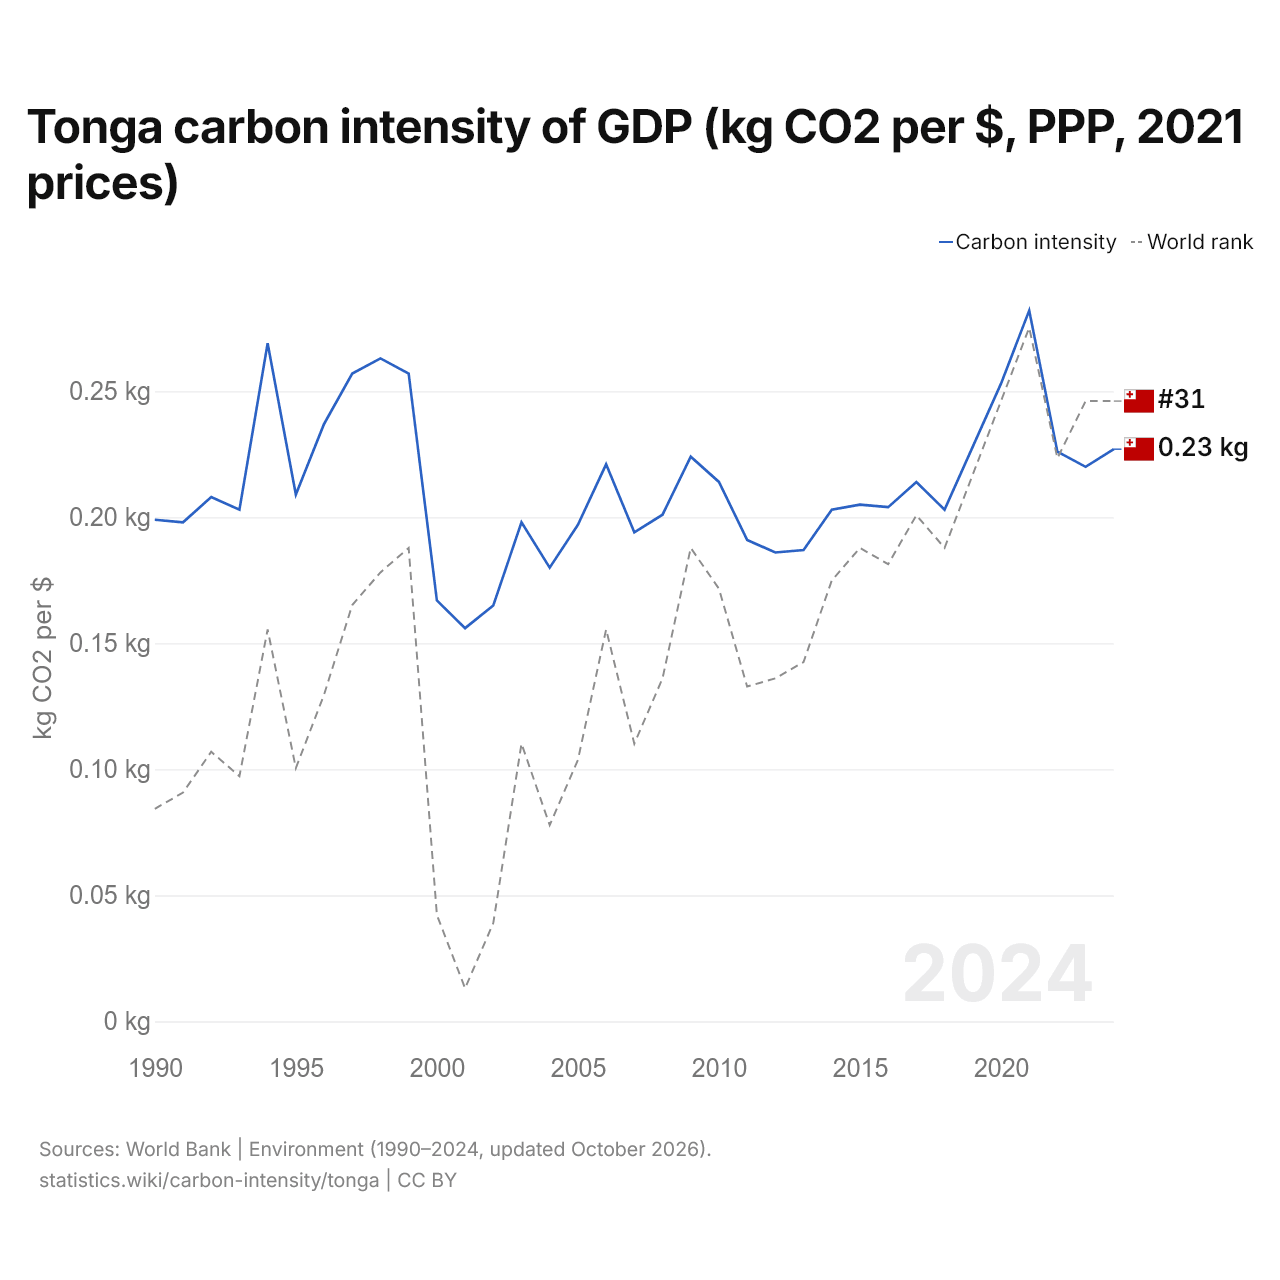
| Year | kg CO2 per $ | World rank |
|---|---|---|
| 2024 | 0.227 kg | #31 |
| 2023 | 0.22 kg | #31 |
| 2022 | 0.226 kg | #38 |
| 2021 | 0.282 kg | #22 |
| 2020 | 0.253 kg | #31 |
| 2019 | 0.228 kg | #40 |
| 2018 | 0.203 kg | #49 |
| 2017 | 0.214 kg | #45 |
| 2016 | 0.204 kg | #51 |
| 2015 | 0.205 kg | #49 |
| 2014 | 0.203 kg | #53 |
| 2013 | 0.187 kg | #63 |
| 2012 | 0.186 kg | #65 |
| 2011 | 0.191 kg | #66 |
| 2010 | 0.214 kg | #54 |
| 2009 | 0.224 kg | #49 |
| 2008 | 0.201 kg | #65 |
| 2007 | 0.194 kg | #73 |
| 2006 | 0.221 kg | #59 |
| 2005 | 0.197 kg | #75 |
| 2004 | 0.18 kg | #83 |
| 2003 | 0.198 kg | #73 |
| 2002 | 0.165 kg | #95 |
| 2001 | 0.156 kg | #103 |
| 2000 | 0.167 kg | #94 |
| 1999 | 0.257 kg | #49 |
| 1998 | 0.263 kg | #52 |
| 1997 | 0.257 kg | #56 |
| 1996 | 0.237 kg | #67 |
| 1995 | 0.209 kg | #76 |
| 1994 | 0.269 kg | #59 |
| 1993 | 0.203 kg | #77 |
| 1992 | 0.208 kg | #74 |
| 1991 | 0.198 kg | #79 |
| 1990 | 0.199 kg | #81 |
The carbon intensity of GDP in Tonga is 0.227 kg of CO2 per dollar, up from 0.199 kg in 1990. Tonga's is close to the world's 0.221 kg. Its carbon intensity was highest in 2021, at 0.282 kg. It is the 31st highest in the world, a rank it has held since 2023. Its highest rank was 22nd, last held in 2021.
Tonga's carbon intensity is the 2nd highest of nine countries in Oceania, where it ranges from Fiji's 0.119 kg to Australia's 0.234 kg. The largest ten-year rise in Tonga's carbon intensity was from 2000 to 2010, by 0.047 kg; the largest ten-year fall was from 1990 to 2000, by 0.032 kg.
Tonga in the world carbon intensity of GDP ranking







Compare Tonga carbon intensity of GDP with other countries
Sources:
- World Bank | Environment (1990–2024, updated October 2026)
Creative Commons Attribution (CC BY): you may copy, share, adapt and reuse this content, also commercially, as long as you credit statistics.wiki and note any changes you made. The sources listed above may have their own license terms.