
United States vs Iran carbon intensity of GDP (kg CO2 per $, PPP, 2021 prices)
1x
| Year | kg CO2 per $ | |
|---|---|---|
 United States |
 Iran |
|
| 2024 | 0.18 kg | 0.518 kg |
| 2023 | 0.184 kg | 0.528 kg |
| 2022 | 0.198 kg | 0.54 kg |
| 2021 | 0.2 kg | 0.558 kg |
| 2020 | 0.2 kg | 0.545 kg |
| 2019 | 0.218 kg | 0.552 kg |
| 2018 | 0.23 kg | 0.5 kg |
| 2017 | 0.23 kg | 0.485 kg |
| 2016 | 0.238 kg | 0.481 kg |
| 2015 | 0.248 kg | 0.513 kg |
| 2014 | 0.261 kg | 0.512 kg |
| 2013 | 0.266 kg | 0.517 kg |
| 2012 | 0.265 kg | 0.492 kg |
| 2011 | 0.282 kg | 0.469 kg |
| 2010 | 0.298 kg | 0.474 kg |
| 2009 | 0.293 kg | 0.498 kg |
| 2008 | 0.308 kg | 0.487 kg |
| 2007 | 0.318 kg | 0.474 kg |
| 2006 | 0.32 kg | 0.481 kg |
| 2005 | 0.334 kg | 0.469 kg |
| 2004 | 0.345 kg | 0.448 kg |
| 2003 | 0.353 kg | 0.436 kg |
| 2002 | 0.359 kg | 0.449 kg |
| 2001 | 0.375 kg | 0.465 kg |
| 2000 | 0.382 kg | 0.458 kg |
| 1999 | 0.386 kg | 0.46 kg |
| 1998 | 0.403 kg | 0.429 kg |
| 1997 | 0.418 kg | 0.438 kg |
| 1996 | 0.416 kg | 0.425 kg |
| 1995 | 0.419 kg | 0.435 kg |
| 1994 | 0.426 kg | 0.437 kg |
| 1993 | 0.436 kg | 0.376 kg |
| 1992 | 0.438 kg | 0.373 kg |
| 1991 | 0.446 kg | 0.362 kg |
| 1990 | 0.45 kg | 0.37 kg |
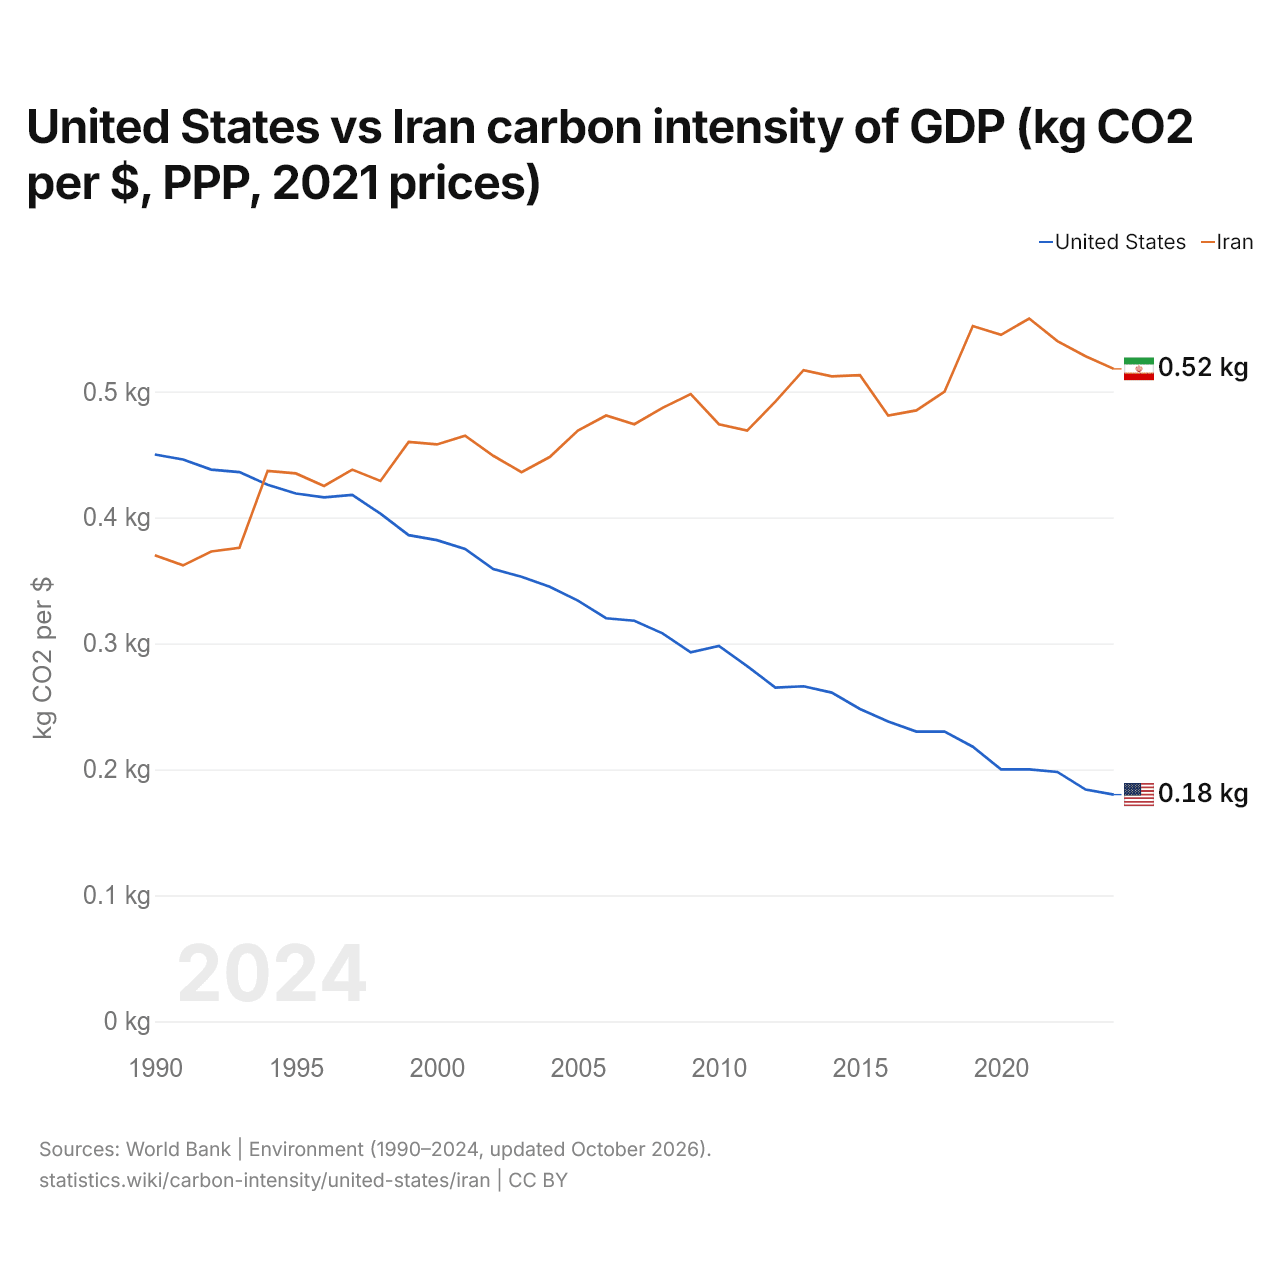
Carbon intensity is 0.180 kg of CO2 per dollar of GDP in the United States and 0.518 kg in Iran: 0.338 kg more in Iran. In 1990, the United States emitted 0.450 kg and Iran 0.370 kg, a difference of 0.080 kg.
Iran's carbon intensity has been higher than the United States' every year since 1994. The gap was widest in 2021, when Iran's carbon intensity was 0.358 kg above the United States'.
United States vs Iran: latest carbon intensity of GDP
|
United States
|
Iran
|
|
|---|---|---|
| kg CO2 per $ of GDP | 0.180 | 0.518 |
| World rank | 53/177 | 4/177 |
| Change since 1990 | −60.0% | +40.0% |
| Carbon intensity difference | 0.35× | 2.9× |
Compare the carbon intensity of GDP of any 2 countries
Sources:
- World Bank | Environment (1990–2024, updated October 2026)
Creative Commons Attribution (CC BY): you may copy, share, adapt and reuse this content, also commercially, as long as you credit statistics.wiki and note any changes you made. The sources listed above may have their own license terms.