
United States vs Cayman Islands carbon intensity of GDP (kg CO2 per $, PPP, 2021 prices)
1x
| Year | kg CO2 per $ | |
|---|---|---|
 United States |
 Cayman Islands |
|
| 2024 | 0.18 kg | 0.062 kg |
| 2023 | 0.184 kg | 0.062 kg |
| 2022 | 0.198 kg | 0.065 kg |
| 2021 | 0.2 kg | 0.06 kg |
| 2020 | 0.2 kg | 0.067 kg |
| 2019 | 0.218 kg | 0.075 kg |
| 2018 | 0.23 kg | 0.062 kg |
| 2017 | 0.23 kg | 0.058 kg |
| 2016 | 0.238 kg | 0.056 kg |
| 2015 | 0.248 kg | 0.056 kg |
| 2014 | 0.261 kg | 0.053 kg |
| 2013 | 0.266 kg | 0.051 kg |
| 2012 | 0.265 kg | 0.045 kg |
| 2011 | 0.282 kg | 0.048 kg |
| 2010 | 0.298 kg | 0.06 kg |
| 2009 | 0.293 kg | 0.054 kg |
| 2008 | 0.308 kg | 0.049 kg |
| 2007 | 0.318 kg | 0.045 kg |
| 2006 | 0.32 kg | 0.037 kg |
| 2005 | 0.334 kg | - |
| 2004 | 0.345 kg | - |
| 2003 | 0.353 kg | - |
| 2002 | 0.359 kg | - |
| 2001 | 0.375 kg | - |
| 2000 | 0.382 kg | - |
| 1999 | 0.386 kg | - |
| 1998 | 0.403 kg | - |
| 1997 | 0.418 kg | - |
| 1996 | 0.416 kg | - |
| 1995 | 0.419 kg | - |
| 1994 | 0.426 kg | - |
| 1993 | 0.436 kg | - |
| 1992 | 0.438 kg | - |
| 1991 | 0.446 kg | - |
| 1990 | 0.45 kg | - |
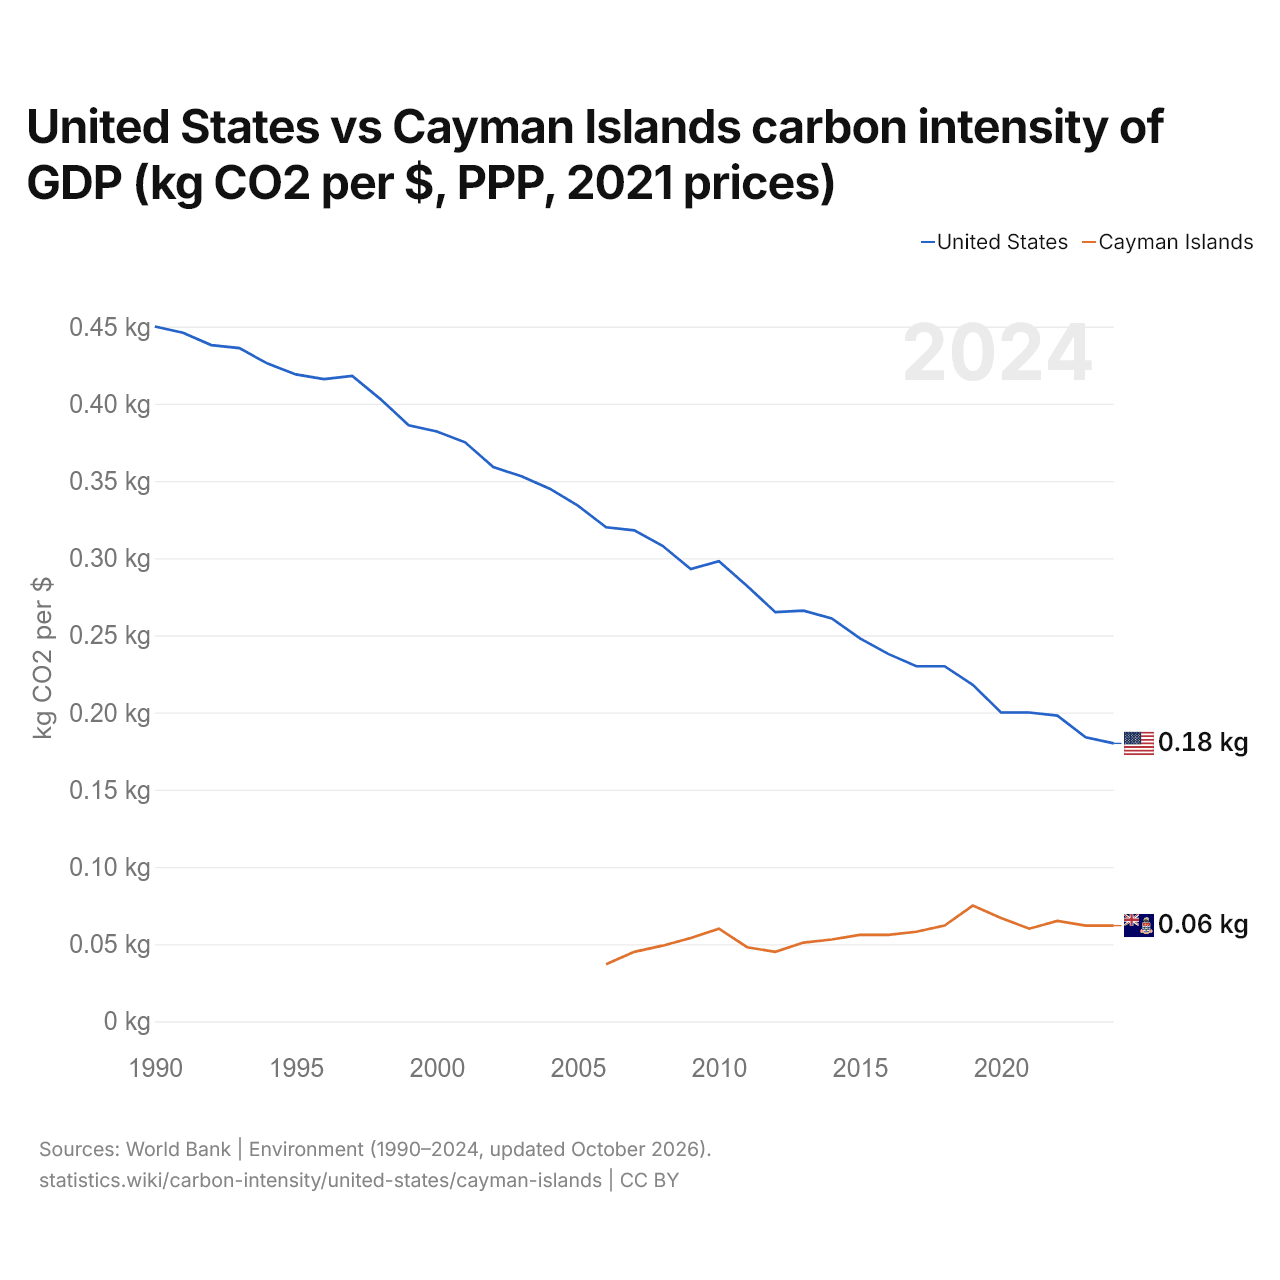
Carbon intensity is 0.180 kg of CO2 per dollar of GDP in the United States and 0.062 kg in the Cayman Islands: 0.118 kg more in the United States. In 2006, the United States emitted 0.320 kg and the Cayman Islands 0.037 kg, a difference of 0.283 kg.
The United States' carbon intensity has been higher than the Cayman Islands' every year since 2006.
United States vs Cayman Islands: latest carbon intensity of GDP
|
United States
|
Cayman Islands
|
|
|---|---|---|
| kg CO2 per $ of GDP | 0.180 | 0.062 |
| World rank | 53/177 | 161/177 |
| Change since 1990 | −60.0% | n/a |
| Carbon intensity difference | 2.9× | 0.34× |
Compare the carbon intensity of GDP of any 2 countries
Sources:
- World Bank | Environment (1990–2024, updated October 2026)
Creative Commons Attribution (CC BY): you may copy, share, adapt and reuse this content, also commercially, as long as you credit statistics.wiki and note any changes you made. The sources listed above may have their own license terms.