
El Salvador carbon intensity of GDP (kg CO2 per $, PPP, 2021 prices)
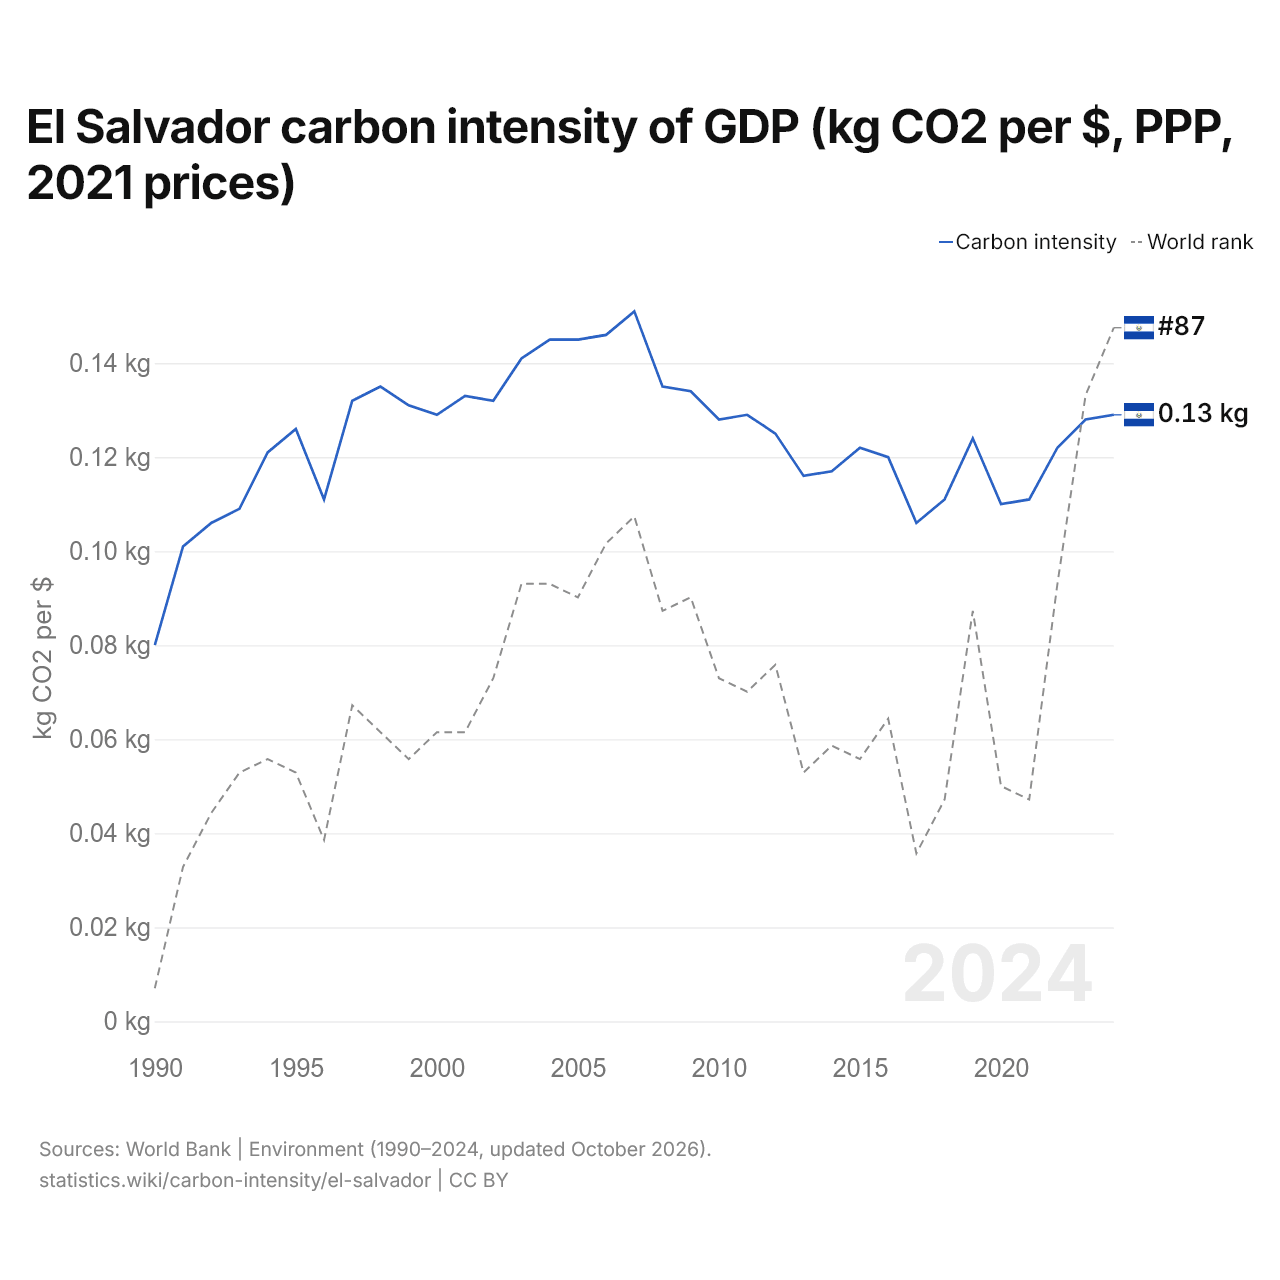
| Year | kg CO2 per $ | World rank |
|---|---|---|
| 2024 | 0.129 kg | #87 |
| 2023 | 0.128 kg | #92 |
| 2022 | 0.122 kg | #106 |
| 2021 | 0.111 kg | #122 |
| 2020 | 0.11 kg | #121 |
| 2019 | 0.124 kg | #108 |
| 2018 | 0.111 kg | #122 |
| 2017 | 0.106 kg | #126 |
| 2016 | 0.12 kg | #116 |
| 2015 | 0.122 kg | #119 |
| 2014 | 0.117 kg | #118 |
| 2013 | 0.116 kg | #120 |
| 2012 | 0.125 kg | #112 |
| 2011 | 0.129 kg | #114 |
| 2010 | 0.128 kg | #113 |
| 2009 | 0.134 kg | #107 |
| 2008 | 0.135 kg | #108 |
| 2007 | 0.151 kg | #101 |
| 2006 | 0.146 kg | #103 |
| 2005 | 0.145 kg | #107 |
| 2004 | 0.145 kg | #106 |
| 2003 | 0.141 kg | #106 |
| 2002 | 0.132 kg | #113 |
| 2001 | 0.133 kg | #117 |
| 2000 | 0.129 kg | #117 |
| 1999 | 0.131 kg | #119 |
| 1998 | 0.135 kg | #117 |
| 1997 | 0.132 kg | #115 |
| 1996 | 0.111 kg | #125 |
| 1995 | 0.126 kg | #120 |
| 1994 | 0.121 kg | #119 |
| 1993 | 0.109 kg | #120 |
| 1992 | 0.106 kg | #123 |
| 1991 | 0.101 kg | #127 |
| 1990 | 0.08 kg | #136 |
The carbon intensity of GDP in El Salvador is 0.129 kg of CO2 per dollar, up from 0.080 kg in 1990. El Salvador's is 58% of the world's 0.221 kg. Its carbon intensity was highest in 2007, at 0.151 kg. It is the 87th highest in the world, up from 92nd the year before.
El Salvador's carbon intensity is the 11th highest of 32 countries in Latin America, where it ranges from Costa Rica's 0.060 kg to Trinidad and Tobago's 0.613 kg. The largest ten-year rise in El Salvador's carbon intensity was from 1990 to 2000, by 0.049 kg; the largest ten-year fall was from 2010 to 2020, by 0.018 kg.
El Salvador in the world carbon intensity of GDP ranking







Compare El Salvador carbon intensity of GDP with other countries
Sources:
- World Bank | Environment (1990–2024, updated October 2026)
Creative Commons Attribution (CC BY): you may copy, share, adapt and reuse this content, also commercially, as long as you credit statistics.wiki and note any changes you made. The sources listed above may have their own license terms.