
Botswana carbon intensity of GDP (kg CO2 per $, PPP, 2021 prices)
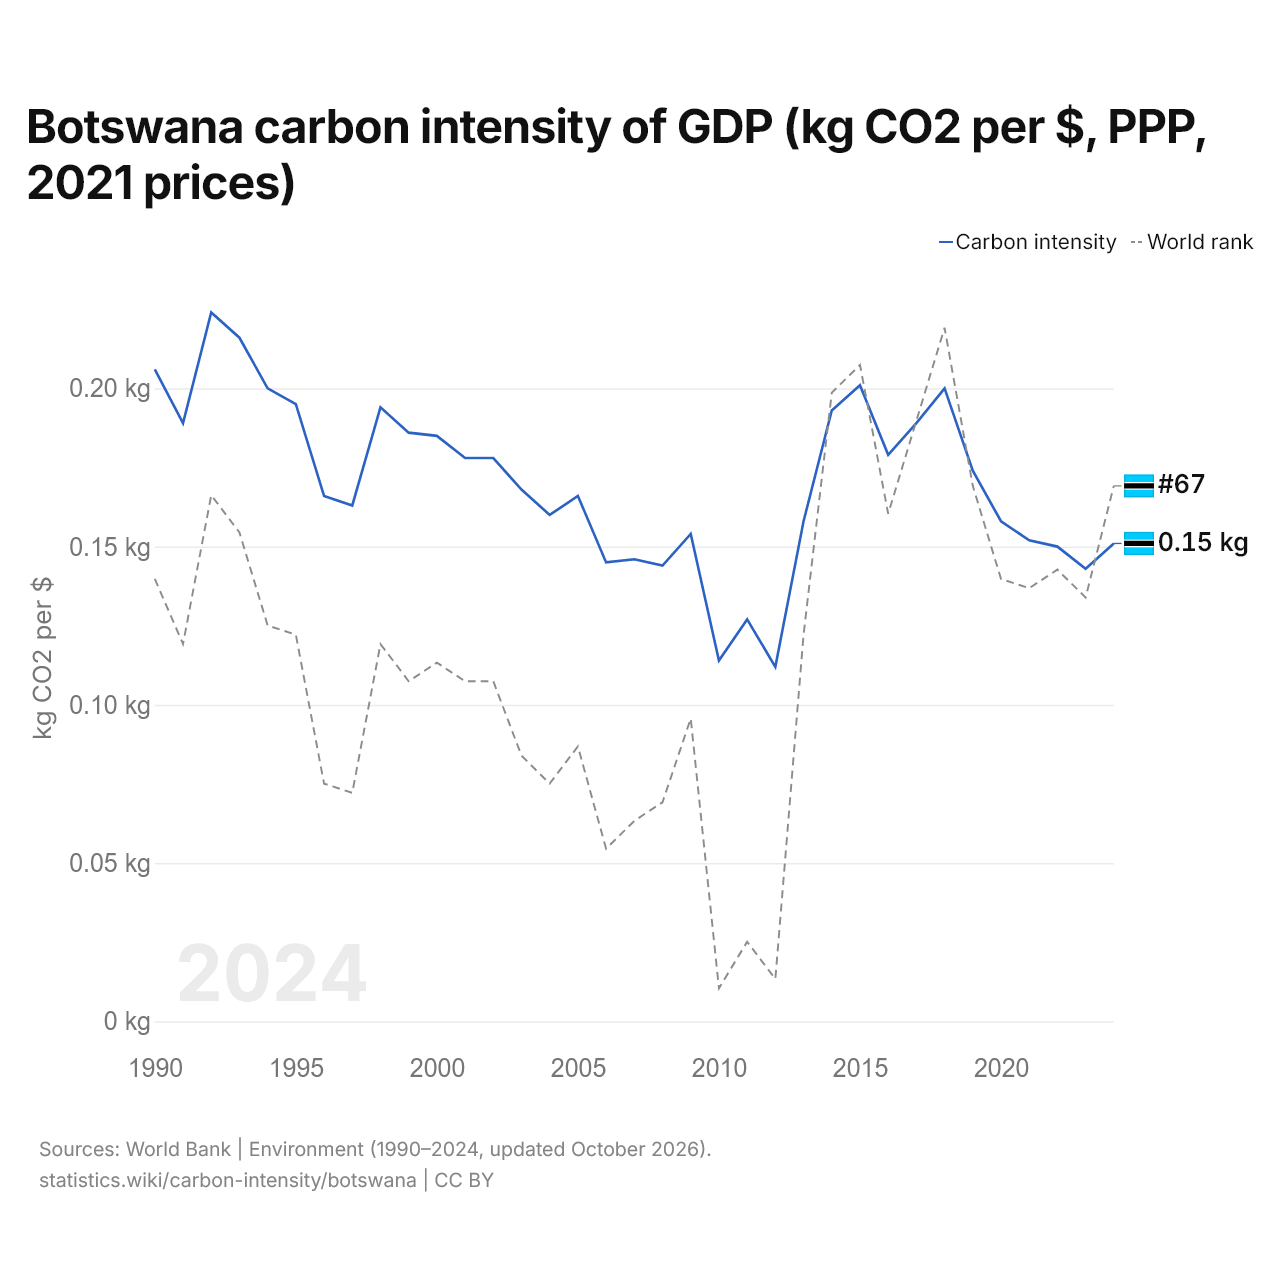
| Year | kg CO2 per $ | World rank |
|---|---|---|
| 2024 | 0.151 kg | #67 |
| 2023 | 0.143 kg | #79 |
| 2022 | 0.15 kg | #76 |
| 2021 | 0.152 kg | #78 |
| 2020 | 0.158 kg | #77 |
| 2019 | 0.174 kg | #67 |
| 2018 | 0.2 kg | #50 |
| 2017 | 0.189 kg | #60 |
| 2016 | 0.179 kg | #70 |
| 2015 | 0.201 kg | #54 |
| 2014 | 0.193 kg | #57 |
| 2013 | 0.158 kg | #83 |
| 2012 | 0.112 kg | #120 |
| 2011 | 0.127 kg | #116 |
| 2010 | 0.114 kg | #121 |
| 2009 | 0.154 kg | #92 |
| 2008 | 0.144 kg | #101 |
| 2007 | 0.146 kg | #103 |
| 2006 | 0.145 kg | #106 |
| 2005 | 0.166 kg | #95 |
| 2004 | 0.16 kg | #99 |
| 2003 | 0.168 kg | #96 |
| 2002 | 0.178 kg | #88 |
| 2001 | 0.178 kg | #88 |
| 2000 | 0.185 kg | #86 |
| 1999 | 0.186 kg | #88 |
| 1998 | 0.194 kg | #84 |
| 1997 | 0.163 kg | #100 |
| 1996 | 0.166 kg | #99 |
| 1995 | 0.195 kg | #83 |
| 1994 | 0.2 kg | #82 |
| 1993 | 0.216 kg | #72 |
| 1992 | 0.224 kg | #68 |
| 1991 | 0.189 kg | #84 |
| 1990 | 0.206 kg | #77 |
The carbon intensity of GDP in Botswana is 0.151 kg of CO2 per dollar, down from 0.206 kg in 1990. Botswana's is 68% of the world's 0.221 kg. Its carbon intensity was highest in 1992, at 0.224 kg. It is the 67th highest in the world, up from 79th the year before. Its highest rank was 50th, last held in 2018.
Botswana's carbon intensity is the 13th highest of 52 countries in Africa, where it ranges from Somalia's 0.032 kg to Libya's 0.689 kg. The largest ten-year fall in Botswana's carbon intensity was from 2000 to 2010, by 0.071 kg; the largest ten-year rise was from 2010 to 2020, by 0.044 kg.
Botswana in the world carbon intensity of GDP ranking







Compare Botswana carbon intensity of GDP with other countries
Sources:
- World Bank | Environment (1990–2024, updated October 2026)
Creative Commons Attribution (CC BY): you may copy, share, adapt and reuse this content, also commercially, as long as you credit statistics.wiki and note any changes you made. The sources listed above may have their own license terms.