
Energy consumption by country (fossil fuels and net imports as % of energy use)
| Rank | Country | TWh | kWh per person | Fossil fuels, % (2022) | Net imports, % |
|---|---|---|---|---|---|
 World |
178,821 | 22,006 | 80.6% | +14.6% (2023) | |
| 1 |  China |
48,287 | 34,271 | 86.7% | +24.0% |
| 2 |  United States |
25,519 | 75,056 | 81.6% (2023) | −9.8% |
| 3 |  India |
13,104 | 9,031 | 74.9% | +36.0% |
| 4 |  Russia |
9,569 | 66,606 | 89.5% | −70.7% |
| 5 |  Japan |
4,332 | 34,939 | 84.8% (2023) | +87.3% |
| 6 |  Brazil |
3,768 | 17,773 | 49.4% (2023) | −10.8% |
| 7 |  Iran |
3,681 | 40,194 | 98.8% | −27.8% |
| 8 |  Canada |
3,416 | 82,798 | 76.8% (2023) | −95.0% |
| 9 |  Indonesia |
3,362 | 11,861 | 77.2% | −92.8% |
| 10 |  South Korea |
3,349 | 64,712 | 79.1% (2023) | +83.2% |
| 11 |  Germany |
2,792 | 33,429 | 77.6% (2023) | +70.3% |
| 12 |  Saudi Arabia |
2,741 | 77,640 | 99.9% | −151.4% |
| 13 |  France |
2,537 | 37,015 | 46.5% (2023) | +41.8% |
| 14 |  Mexico |
2,280 | 17,422 | 88.7% (2023) | +27.4% |
| 15 |  Turkey |
1,925 | 22,513 | 81.4% (2023) | +70.1% |
| 16 |  United Kingdom |
1,688 | 24,370 | 75.5% (2023) | +47.6% |
| 17 |  Australia |
1,581 | 58,148 | 90.2% (2023) | −211.2% |
| 18 |  Italy |
1,542 | 26,148 | 76.8% (2023) | +79.2% |
| 19 |  Thailand |
1,529 | 21,338 | 79.7% | +57.3% |
| 20 |  South Africa |
1,419 | 22,176 | 93.3% | −13.6% |
| 21 |  Vietnam |
1,396 | 13,819 | 79.4% | +48.3% |
| 22 |  Malaysia |
1,314 | 36,942 | 96.0% | +8.5% |
| 23 |  Spain |
1,310 | 26,825 | 68.5% (2023) | +78.4% |
| 24 |  Egypt |
1,197 | 10,272 | 94.7% | +26.4% |
| 25 |  Pakistan |
1,136 | 4,521 | 63.9% | +30.4% |
| 26 |  UAE |
1,129 | 102,784 | 92.7% | −139.6% |
| 27 |  Poland |
1,115 | 30,493 | 84.6% (2023) | +46.8% |
| 28 |  Argentina |
923 | 20,198 | 87.0% | −13.9% |
| 29 |  Kazakhstan |
867 | 42,088 | 98.2% | −112.4% |
| 30 |  Nigeria |
859 | 3,690 | 55.7% | −83.1% |
| 31 |  Algeria |
842 | 17,984 | 100.0% | −119.3% |
| 32 |  Philippines |
825 | 7,122 | 66.2% | +57.7% |
| 33 |  Iraq |
824 | 17,906 | 98.7% | −223.3% |
| 34 |  Ukraine |
723 | 19,098 | 65.5% | +23.2% |
| 35 |  Netherlands |
715 | 39,764 | 83.5% (2023) | +88.4% |
| 36 |  Uzbekistan |
636 | 17,477 | 98.4% | +27.7% |
| 37 |  Taiwan |
623 (2025) | 26,692 (2025) | n/a | n/a |
| 38 |  Ethiopia |
604 | 4,573 | 9.7% | +10.3% |
| 39 |  Bangladesh |
582 | 3,353 | 83.1% | +48.5% |
| 40 |  Kuwait |
563 | 115,058 | 99.9% | −218.7% |
| 41 |  Belgium |
562 | 47,411 | 69.3% (2023) | +88.5% |
| 42 |  Sweden |
532 | 50,343 | 24.9% (2023) | +27.7% |
| 43 |  Colombia |
519 | 9,814 | 75.3% (2023) | −147.1% |
| 44 |  DR Congo |
510 | 4,670 | 4.0% | +1.1% |
| 45 |  Qatar |
504 | 176,255 | 99.9% | −395.5% |
| 46 |  Venezuela |
481 | 16,951 | 85.9% | −100.6% |
| 47 |  Chile |
475 | 24,038 | 66.7% (2023) | +61.5% |
| 48 |  Czech Republic |
433 | 39,734 | 67.8% (2023) | +40.0% |
| 49 |  Turkmenistan |
408 | 54,453 | 100.0% | −105.3% |
| 50 |  Kenya |
370 | 6,553 | 19.8% (2023) | +22.4% |
| 51 |  Finland |
369 | 65,679 | 32.7% (2023) | +33.9% |
| 52 |  Singapore |
368 | 61,006 | 97.9% | +293.9% |
| 53 |  Romania |
353 | 18,504 | 70.4% | +30.4% |
| 54 |  Austria |
352 | 38,310 | 62.1% (2023) | +56.2% |
| 55 |  Peru |
334 | 9,772 | 76.9% | +15.5% |
| 56 |  Oman |
333 | 63,053 | 99.7% | −202.7% |
| 57 |  Norway |
316 | 56,723 | 46.3% (2023) | −729.0% |
| 58 |  Belarus |
315 | 34,488 | 86.6% | +71.1% |
| 59 |  Tanzania |
310 | 4,525 | 23.1% | +15.1% |
| 60 |  Uganda |
293 | 5,853 | 0.0% (2024) | +9.8% |
| 61 |  Libya |
285 | 38,634 | 96.3% | −185.8% |
| 62 |  Israel |
284 | 28,411 | 96.5% (2023) | +4.7% |
| 63 |  Hungary |
280 | 29,319 | 64.2% (2023) | +49.5% |
| 64 |  Morocco |
271 | 7,123 | 90.1% | +93.9% |
| 65 |  Myanmar |
264 | 4,850 | 45.1% | −10.0% |
| 66 |  Switzerland |
260 | 28,877 | 44.5% (2023) | +48.0% |
| 67 |  Greece |
237 | 22,749 | 79.1% (2023) | +93.5% |
| 68 |  Portugal |
226 | 21,140 | 63.1% (2023) | +74.2% |
| 69 |  North Korea |
220 | 8,298 | 85.1% | +5.0% |
| 70 |  New Zealand |
220 | 41,544 | 55.4% (2023) | +35.2% |
| 71 |  Sudan |
210 | 4,170 | 30.2% | +15.3% |
| 72 |  Azerbaijan |
206 | 20,142 | 100.0% | −254.7% |
| 73 |  Zambia |
201 | 9,449 | 18.4% | +12.7% |
| 74 |  Guatemala |
201 | 10,933 | 34.6% | +40.0% |
| 75 |  Ecuador |
195 | 10,779 | 84.0% | −60.9% |
| 76 |  Bulgaria |
195 | 30,332 | 68.8% | +43.3% |
| 77 |  Angola |
187 | 4,933 | 47.0% | −335.5% |
| 78 |  Slovakia |
184 | 34,016 | 59.5% (2023) | +53.1% |
| 79 |  Serbia |
182 | 27,559 | 83.0% | +41.2% |
| 80 |  Ivory Coast |
177 | 5,551 | 37.6% | +12.1% |
| 81 |  Bahrain |
176 | 110,612 | 100.0% | −48.5% |
| 82 |  Denmark |
173 | 28,989 | 50.0% (2023) | +44.5% |
| 83 |  Trinidad |
167 | 122,185 | 99.9% | −69.0% |
| 84 |  Ghana |
158 | 4,593 | 62.0% | −5.1% |
| 85 |  Nepal |
155 | 5,241 | 26.5% | +27.8% |
| 86 |  Ireland |
155 | 28,721 | 82.4% (2023) | +87.2% |
| 87 |  Mozambique |
147 | 4,231 | 24.6% | −186.5% |
| 88 |  Dominican Republic |
127 | 11,095 | 89.4% | +94.2% |
| 89 |  Cambodia |
122 | 6,899 | 54.9% | +66.6% (2023) |
| 90 |  Bolivia |
120 | 9,691 | 84.8% | −25.6% |
| 91 |  Tunisia |
120 | 9,778 | 86.8% | +66.0% |
| 92 |  Madagascar |
112 | 3,517 | 0.0% (2024) | +13.7% (2017) |
| 93 |  Sri Lanka |
112 | 5,106 | 53.9% | +59.5% |
| 94 |  Cameroon |
112 | 3,835 | 22.9% | −26.5% |
| 95 |  Jordan |
105 | 9,075 | 91.1% | +81.7% |
| 96 |  Croatia |
100 | 25,973 | 68.0% | +62.7% |
| 97 |  Cuba |
99.3 | 9,041 | 88.1% | +69.3% |
| 98 |  Mongolia |
98.2 | 27,866 | 94.7% | −498.3% |
| 99 |  Syria |
95.5 | 3,870 | 99.5% | +42.3% |
| 100 |  Zimbabwe |
94.8 | 5,701 | 45.3% | +15.2% |
| 101 |  Burkina Faso |
91.1 | 3,869 | 0.0% (2024) | n/a |
| 102 |  Lithuania |
85.7 | 29,679 | 61.4% (2023) | +68.8% |
| 103 |  Paraguay |
85.1 | 12,285 | 34.8% | +16.7% |
| 104 |  Bosnia |
80.1 | 25,328 | 78.8% | +27.9% |
| 105 |  Uruguay |
77.2 | 22,786 | 44.9% | +37.9% |
| 106 |  Laos |
76.1 | 9,793 | 0.0% (2024) | −59.1% |
| 107 |  Slovenia |
74.2 | 34,882 | 57.8% (2023) | +46.0% |
| 108 |  Honduras |
73.7 | 6,812 | 54.7% | +62.5% |
| 109 |  Iceland |
73 | 188,964 | 10.3% (2023) | n/a |
| 110 |  Benin |
72.4 | 5,006 | 39.6% | +43.8% |
| 111 |  Yemen |
70.4 | 1,735 | 93.1% | +71.7% |
| 112 |  Senegal |
69.6 | 3,764 | 63.2% | +76.4% |
| 113 |  Georgia |
68.8 | 18,039 | 78.9% | +81.1% |
| 114 |  Costa Rica |
66.9 | 13,037 | 51.6% (2023) | +58.9% |
| 115 |  Rwanda |
59.6 | 4,181 | 0.0% (2024) | +12.0% |
| 116 |  Kyrgyzstan |
59.5 | 8,232 | 72.9% | +40.7% |
| 117 |  El Salvador |
58 | 9,152 | 55.5% | +62.1% |
| 118 |  Gabon |
57 | 22,465 | 22.8% | −220.0% |
| 119 |  Niger |
54.5 | 2,017 | 0.0% (2024) | −26.9% |
| 120 |  Panama |
52.6 | 11,651 | 76.5% | +203.7% |
| 121 |  Tajikistan |
51.7 | 4,882 | 60.9% | +32.0% |
| 122 |  Lebanon |
49.5 | 8,522 | 89.2% | +89.5% |
| 123 |  Estonia |
49.4 | 36,031 | 60.9% (2023) | +6.1% |
| 124 |  Nicaragua |
49.3 | 7,133 | 39.9% | +47.0% |
| 125 |  Latvia |
49.1 | 26,324 | 47.8% (2023) | +30.6% |
| 126 |  Togo |
48.2 | 5,739 | 16.9% | +18.0% (2018) |
| 127 |  Brunei |
48.1 | 103,861 | 100.0% | −203.8% |
| 128 |  Armenia |
46.3 | 15,255 | 75.8% | +76.2% |
| 129 |  Haiti |
44.5 | 3,779 | 21.7% | n/a |
| 130 |  Chad |
40.4 | 1,988 | 0.0% (2024) | −174.3% |
| 131 |  Moldova |
40 | 16,650 | 81.3% | +85.1% |
| 132 |  Botswana |
39.5 | 15,660 | 66.7% | +25.3% |
| 133 |  Congo |
39 | 6,165 | 51.8% | −370.8% |
| 134 |  Luxembourg |
35.6 | 52,587 | 70.4% (2023) | +109.8% |
| 135 |  North Macedonia |
29.5 | 16,148 | 82.2% | +65.7% |
| 136 |  Jamaica |
27.7 | 9,740 | 92.1% | +112.2% |
| 137 |  Equatorial Guinea |
27.5 | 14,550 | 0.0% (2024) | −319.6% |
| 138 |  Cyprus |
27.2 | 20,006 | 86.5% | +109.9% |
| 139 |  Albania |
24.5 | 10,324 | 55.1% | +29.1% |
| 140 |  Namibia |
23.9 | 7,872 | 53.5% | +61.8% |
| 141 |  Mauritius |
17.8 | 14,289 | 88.9% | n/a |
| 142 |  Eswatini |
14.1 | 11,366 | 0.0% (2024) | +17.3% |
| 143 |  Montenegro |
12.8 | 20,523 | 72.2% | +34.2% |
| 144 |  Suriname |
12.5 | 19,633 | 90.4% | +13.8% |
| 145 |  Eritrea |
12.1 | 3,425 | 22.4% | +34.8% (2004) |
| 146 |  Malta |
9.06 | 15,932 | 87.2% | +387.2% |
| 147 |  South Sudan |
8.78 | 735 | 73.4% | −504.0% |
| 148 |  Curacao |
6.97 | 44,669 | 0.0% (2024) | +270.5% (2018) |
| Not ranked: latest data before 2015 | |||||
 Bahamas |
8.25 (2007) | 23,337 (2007) | 0.0% (2007) | n/a | |
 Fiji |
6.09 (2007) | 6,788 (2007) | 0.0% (2007) | n/a | |
 Guyana |
5.82 (2007) | 7,683 (2007) | 0.0% (2007) | n/a | |
 Barbados |
4.66 (2007) | 17,191 (2007) | 0.0% (2007) | n/a | |
 Maldives |
3.48 (2007) | 10,717 (2007) | 0.0% (2007) | n/a | |
 Bhutan |
2.84 (2007) | 4,181 (2007) | 0.0% (2007) | n/a | |
 Seychelles |
2.38 (2007) | 28,038 (2007) | 0.0% (2007) | n/a | |
 Belize |
2.07 (2007) | 6,991 (2007) | 0.0% (2007) | n/a | |
 Antigua |
1.7 (2007) | 20,782 (2007) | 0.0% (2007) | n/a | |
 Djibouti |
1.66 (2007) | 1,902 (2007) | 0.0% (2007) | n/a | |
 Gambia |
1.55 (2007) | 876 (2007) | 0.0% (2007) | n/a | |
 Saint Lucia |
1.49 (2007) | 8,874 (2007) | 0.0% (2007) | n/a | |
 Cape Verde |
1.2 (2007) | 2,414 (2007) | 0.0% (2007) | n/a | |
 Guinea-Bissau |
1.1 (2007) | 761 (2007) | 0.0% (2007) | n/a | |
 Saint Kitts |
0.97 (2007) | 20,667 (2007) | 0.0% (2007) | n/a | |
 Grenada |
0.94 (2007) | 8,523 (2007) | 0.0% (2007) | n/a | |
 Palau |
0.85 (1990) | 55,991 (1990) | n/a | n/a | |
 Saint Vincent |
0.81 (2007) | 7,299 (2007) | 0.0% (2007) | n/a | |
 Solomon Islands |
0.74 (2007) | 1,488 (2007) | 0.0% (2007) | n/a | |
 East Timor |
0.71 (2007) | 706 (2007) | 0.0% (2007) | n/a | |
 Samoa |
0.67 (2007) | 3,574 (2007) | 0.0% (2007) | n/a | |
 Tonga |
0.67 (2007) | 6,320 (2007) | 0.0% (2007) | n/a | |
 Sao Tome |
0.51 (2007) | 3,015 (2007) | 0.0% (2007) | n/a | |
 Dominica |
0.5 (2007) | 7,264 (2007) | 0.0% (2007) | n/a | |
 Comoros |
0.48 (2007) | 773 (2007) | 0.0% (2007) | n/a | |
 Vanuatu |
0.41 (2007) | 1,840 (2007) | 0.0% (2007) | n/a | |
 Marshall Islands |
0.37 (2007) | 7,152 (2007) | 0.0% (2007) | n/a | |
 Lesotho |
0.22 (2007) | 113 (2007) | 0.0% (2007) | n/a | |
 Kiribati |
0.13 (2007) | 1,253 (2007) | 0.0% (2007) | n/a | |
The list ranks 148 countries by their latest energy consumption, from China (48,287 TWh) to Curacao (6.97 TWh). The world consumes 178,821 TWh of energy. That is 22,006 kWh per person; fossil fuels make up 80.6% of the world's energy use.
Energy consumption here is a country's use of primary energy: the coal, oil, gas, nuclear fuel, hydropower and other renewable energy it produces, plus what it imports, minus what it exports and the fuel taken on by ships and planes on international routes, before any of it is turned into electricity, heat or fuels. The World Bank gives it in kilograms of oil equivalent per person; the pages convert it to kilowatt-hours (kWh) per person and, with the population, to terawatt-hours (TWh, a billion kWh) per country.
Energy consumption per capita by country map
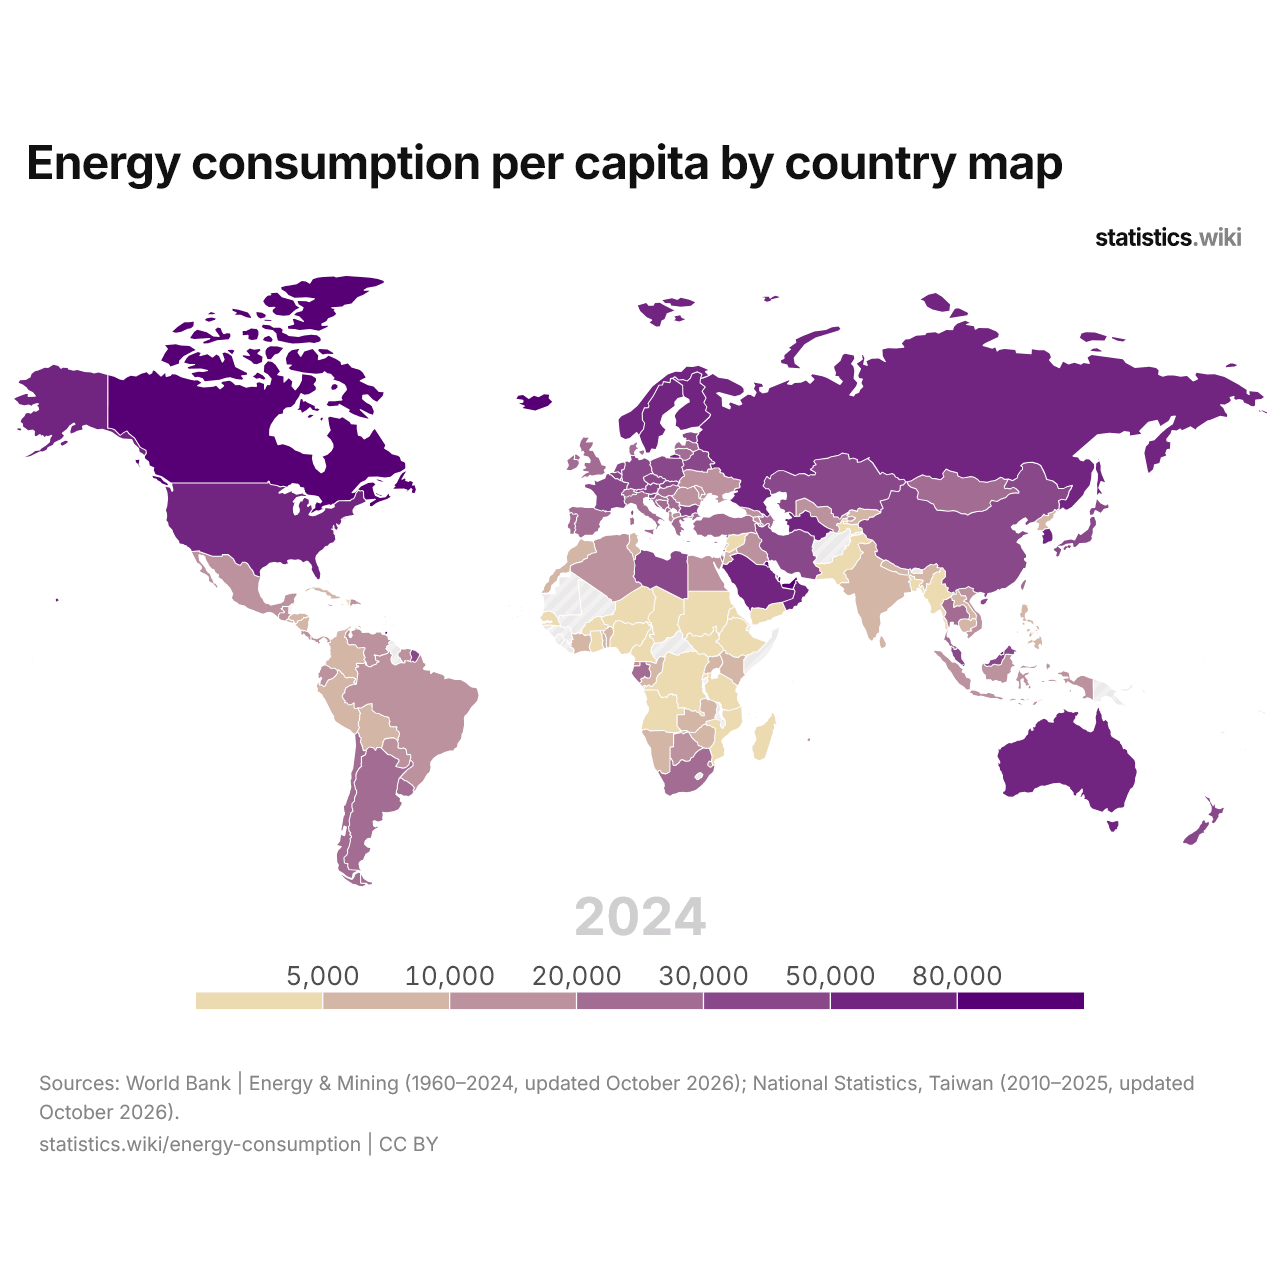
Energy consumption is above 50,000 kWh per person in 20 countries and below 5,000 kWh in 24; in 1990, the numbers were 27 and 47.
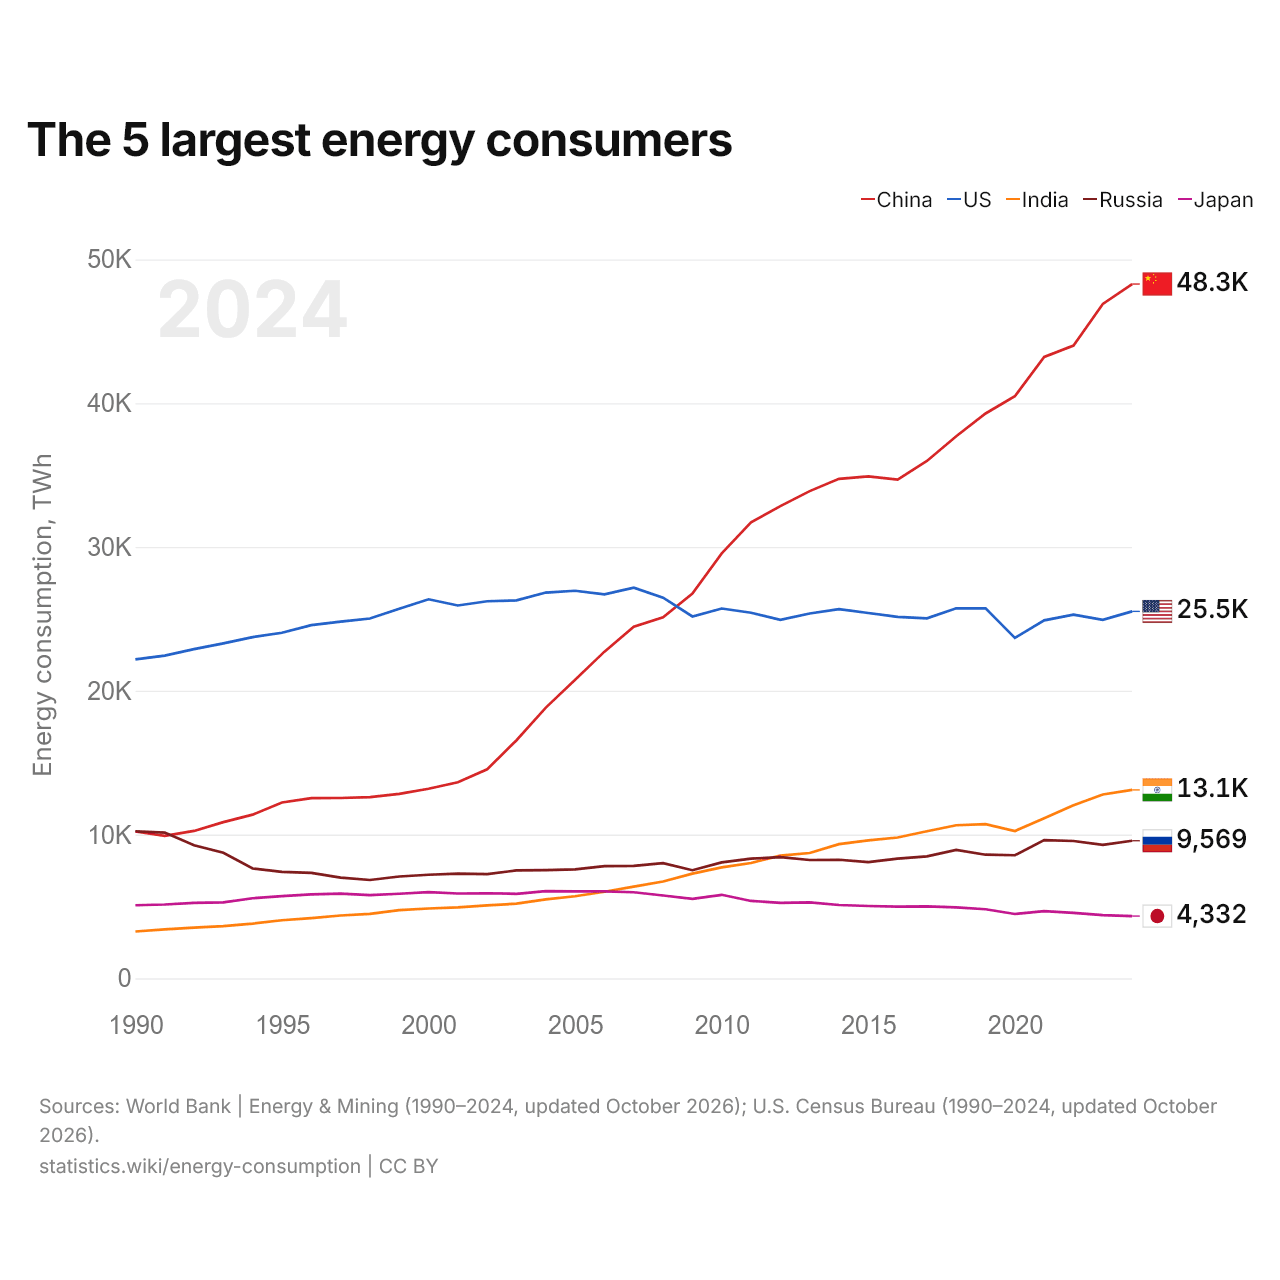
The 5 largest energy consumers
| Year | Energy consumption, TWh | ||||
|---|---|---|---|---|---|
| China | United States | India | Russia | Japan | |
| 2024 | 48,287 | 25,519 | 13,104 | 9,569 | 4,332 |
| 2023 | 46,901 | 24,928 | 12,790 | 9,285 | 4,401 |
| 2022 | 44,011 | 25,296 | 12,033 | 9,549 | 4,557 |
| 2021 | 43,217 | 24,896 | 11,139 | 9,613 | 4,672 |
| 2020 | 40,485 | 23,674 | 10,243 | 8,562 | 4,474 |
| 2019 | 39,285 | 25,735 | 10,722 | 8,598 | 4,804 |
| 2018 | 37,700 | 25,737 | 10,645 | 8,927 | 4,930 |
| 2017 | 35,982 | 25,035 | 10,225 | 8,481 | 5,007 |
| 2016 | 34,688 | 25,136 | 9,793 | 8,325 | 4,982 |
| 2015 | 34,906 | 25,412 | 9,597 | 8,082 | 5,028 |
| 2014 | 34,742 | 25,678 | 9,331 | 8,246 | 5,101 |
| 2013 | 33,886 | 25,374 | 8,717 | 8,228 | 5,287 |
| 2012 | 32,841 | 24,934 | 8,535 | 8,431 | 5,250 |
| 2011 | 31,715 | 25,422 | 8,022 | 8,324 | 5,382 |
| 2010 | 29,556 | 25,719 | 7,716 | 8,063 | 5,809 |
| 2009 | 26,763 | 25,165 | 7,282 | 7,521 | 5,523 |
| 2008 | 25,111 | 26,471 | 6,736 | 8,006 | 5,760 |
| 2007 | 24,454 | 27,172 | 6,378 | 7,823 | 5,986 |
| 2006 | 22,721 | 26,701 | 6,020 | 7,801 | 6,043 |
| 2005 | 20,769 | 26,957 | 5,706 | 7,580 | 6,043 |
| 2004 | 18,827 | 26,829 | 5,489 | 7,531 | 6,070 |
| 2003 | 16,559 | 26,288 | 5,191 | 7,506 | 5,877 |
| 2002 | 14,536 | 26,227 | 5,072 | 7,249 | 5,918 |
| 2001 | 13,631 | 25,931 | 4,931 | 7,280 | 5,900 |
| 2000 | 13,188 | 26,364 | 4,859 | 7,203 | 6,000 |
| 1999 | 12,832 | 25,702 | 4,745 | 7,084 | 5,882 |
| 1998 | 12,601 | 25,025 | 4,482 | 6,839 | 5,789 |
| 1997 | 12,539 | 24,813 | 4,371 | 7,003 | 5,897 |
| 1996 | 12,530 | 24,568 | 4,189 | 7,331 | 5,836 |
| 1995 | 12,230 | 24,034 | 4,039 | 7,406 | 5,714 |
| 1994 | 11,384 | 23,732 | 3,807 | 7,641 | 5,567 |
| 1993 | 10,863 | 23,300 | 3,636 | 8,737 | 5,279 |
| 1992 | 10,251 | 22,898 | 3,530 | 9,254 | 5,248 |
| 1991 | 9,912 | 22,448 | 3,405 | 10,134 | 5,134 |
| 1990 | 10,209 | 22,184 | 3,255 | 10,227 | 5,081 |
The five largest energy consumers are China (48,287 TWh), the United States (25,519 TWh), India (13,104 TWh), Russia (9,569 TWh) and Japan (4,332 TWh). China's energy consumption has been the highest of the five since 2009. The most recent change in their order came in 2012, when India's energy consumption passed Russia's.
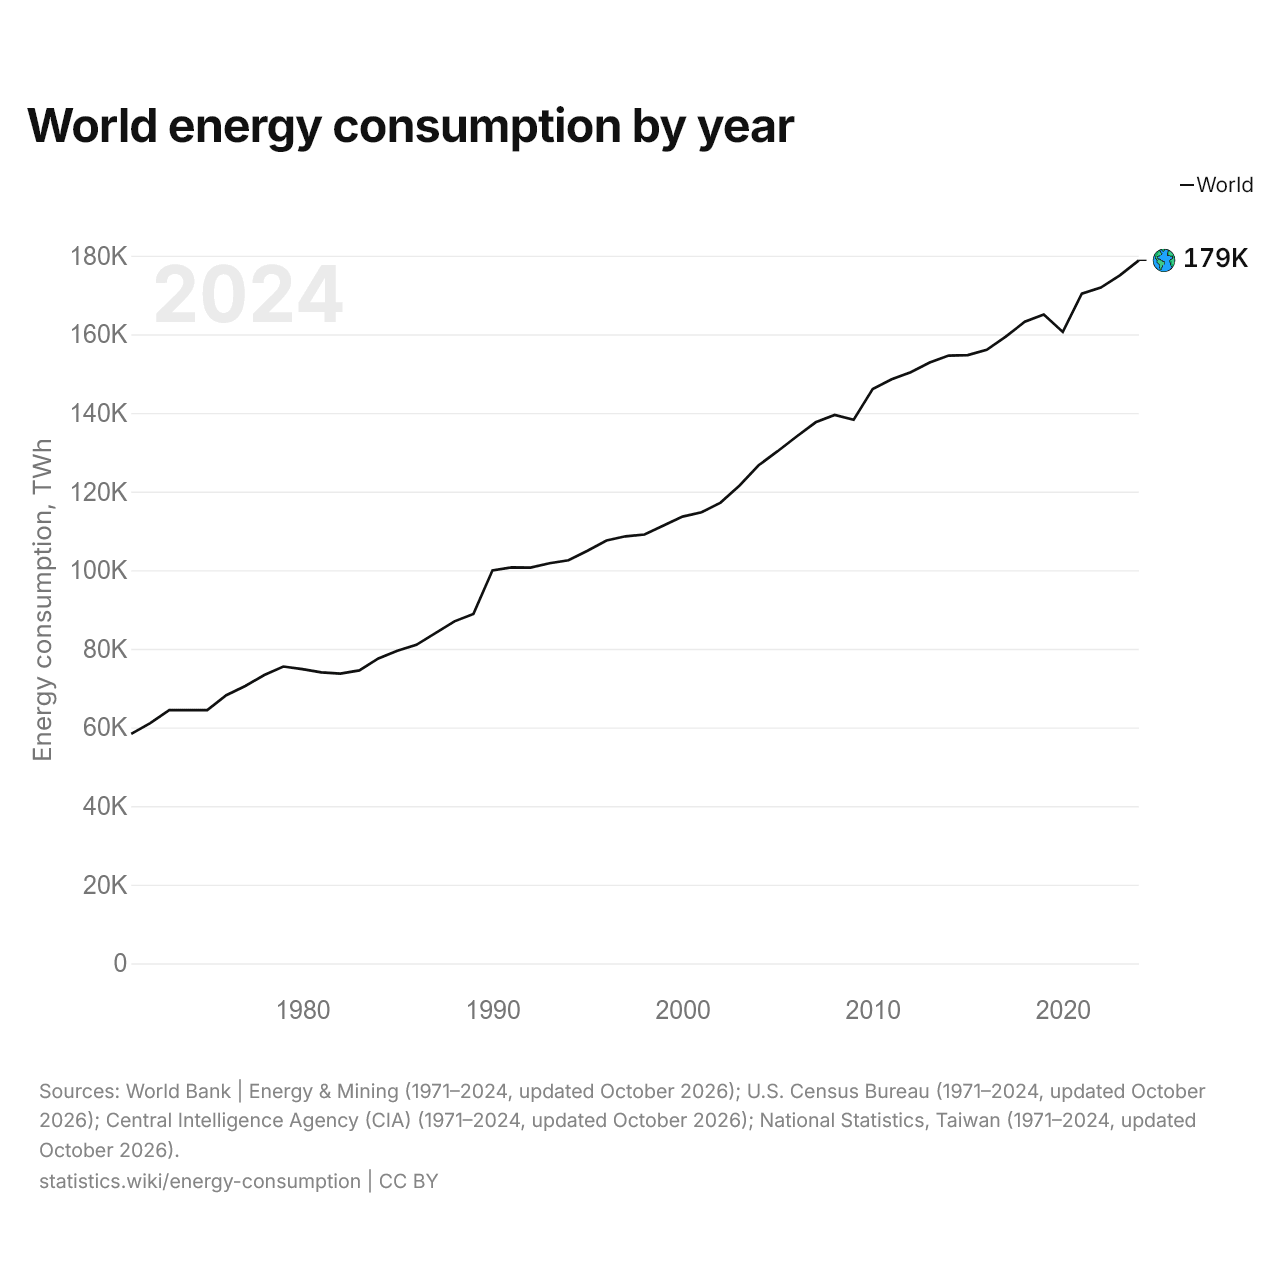
World energy consumption by year
| Year | Energy consumption, TWh |
|---|---|
| World | |
| 2024 | 178,821 |
| 2023 | 174,983 |
| 2022 | 171,879 |
| 2021 | 170,360 |
| 2020 | 160,613 |
| 2019 | 165,038 |
| 2018 | 163,198 |
| 2017 | 159,414 |
| 2016 | 156,063 |
| 2015 | 154,709 |
| 2014 | 154,600 |
| 2013 | 152,846 |
| 2012 | 150,370 |
| 2011 | 148,549 |
| 2010 | 146,059 |
| 2009 | 138,275 |
| 2008 | 139,501 |
| 2007 | 137,621 |
| 2006 | 134,017 |
| 2005 | 130,270 |
| 2004 | 126,701 |
| 2003 | 121,561 |
| 2002 | 117,194 |
| 2001 | 114,734 |
| 2000 | 113,634 |
| 1999 | 111,393 |
| 1998 | 109,075 |
| 1997 | 108,621 |
| 1996 | 107,559 |
| 1995 | 104,951 |
| 1994 | 102,514 |
| 1993 | 101,765 |
| 1992 | 100,652 |
| 1991 | 100,704 |
| 1990 | 99,942 |
| 1989 | 88,883 |
| 1988 | 86,985 |
| 1987 | 84,002 |
| 1986 | 81,024 |
| 1985 | 79,500 |
| 1984 | 77,567 |
| 1983 | 74,520 |
| 1982 | 73,711 |
| 1981 | 74,018 |
| 1980 | 74,829 |
| 1979 | 75,494 |
| 1978 | 73,348 |
| 1977 | 70,559 |
| 1976 | 68,193 |
| 1975 | 64,414 |
| 1974 | 64,389 |
| 1973 | 64,412 |
| 1972 | 61,107 |
| 1971 | 58,365 |
The world consumes 178,821 TWh of energy, compared with 58,365 TWh in 1971. Its consumption fell in 1974, 1980, 1981, 1982, 1992, 2009 and 2020 and rose in the other years since 1971.
Compare the energy consumption of any 2 countries
Sources:
- World Bank | Energy & Mining (1960–2024, updated October 2026)
- National Statistics, Taiwan (1971–2025, updated October 2026)
- U.S. Census Bureau (1971–2024, updated October 2026)
- Central Intelligence Agency (CIA) (1971–2024, updated October 2026)
Creative Commons Attribution (CC BY): you may copy, share, adapt and reuse this content, also commercially, as long as you credit statistics.wiki and note any changes you made. The sources listed above may have their own license terms.