
Slovenia energy consumption by year
| Year | Energy consumption, TWh | World rank |
|---|---|---|
| Slovenia | ||
| 2024 | 74.2 | #107 |
| 2023 | 71.4 | #108 |
| 2022 | 74.8 | #105 |
| 2021 | 77.1 | #103 |
| 2020 | 75 | #104 |
| 2019 | 79.4 | #103 |
| 2018 | 80.6 | #103 |
| 2017 | 81.5 | #101 |
| 2016 | 79.2 | #100 |
| 2015 | 76.7 | #100 |
| 2014 | 77.6 | #101 |
| 2013 | 79.9 | #100 |
| 2012 | 82 | #99 |
| 2011 | 85.5 | #94 |
| 2010 | 85.5 | #94 |
| 2009 | 83.4 | #95 |
| 2008 | 92.9 | #91 |
| 2007 | 88.2 | #92 |
| 2006 | 87.2 | #91 |
| 2005 | 87.6 | #91 |
| 2004 | 84.5 | #91 |
| 2003 | 82.2 | #90 |
| 2002 | 80.8 | #92 |
| 2001 | 80.7 | #91 |
| 2000 | 75.9 | #93 |
| 1999 | 74.8 | #94 |
| 1998 | 75 | #92 |
| 1997 | 76.5 | #90 |
| 1996 | 73.6 | #90 |
| 1995 | 70.6 | #89 |
| 1994 | 65.4 | #94 |
| 1993 | 62.9 | #95 |
| 1992 | 60 | #97 |
| 1991 | 64.6 | #96 |
| 1990 | 66.4 | #94 |
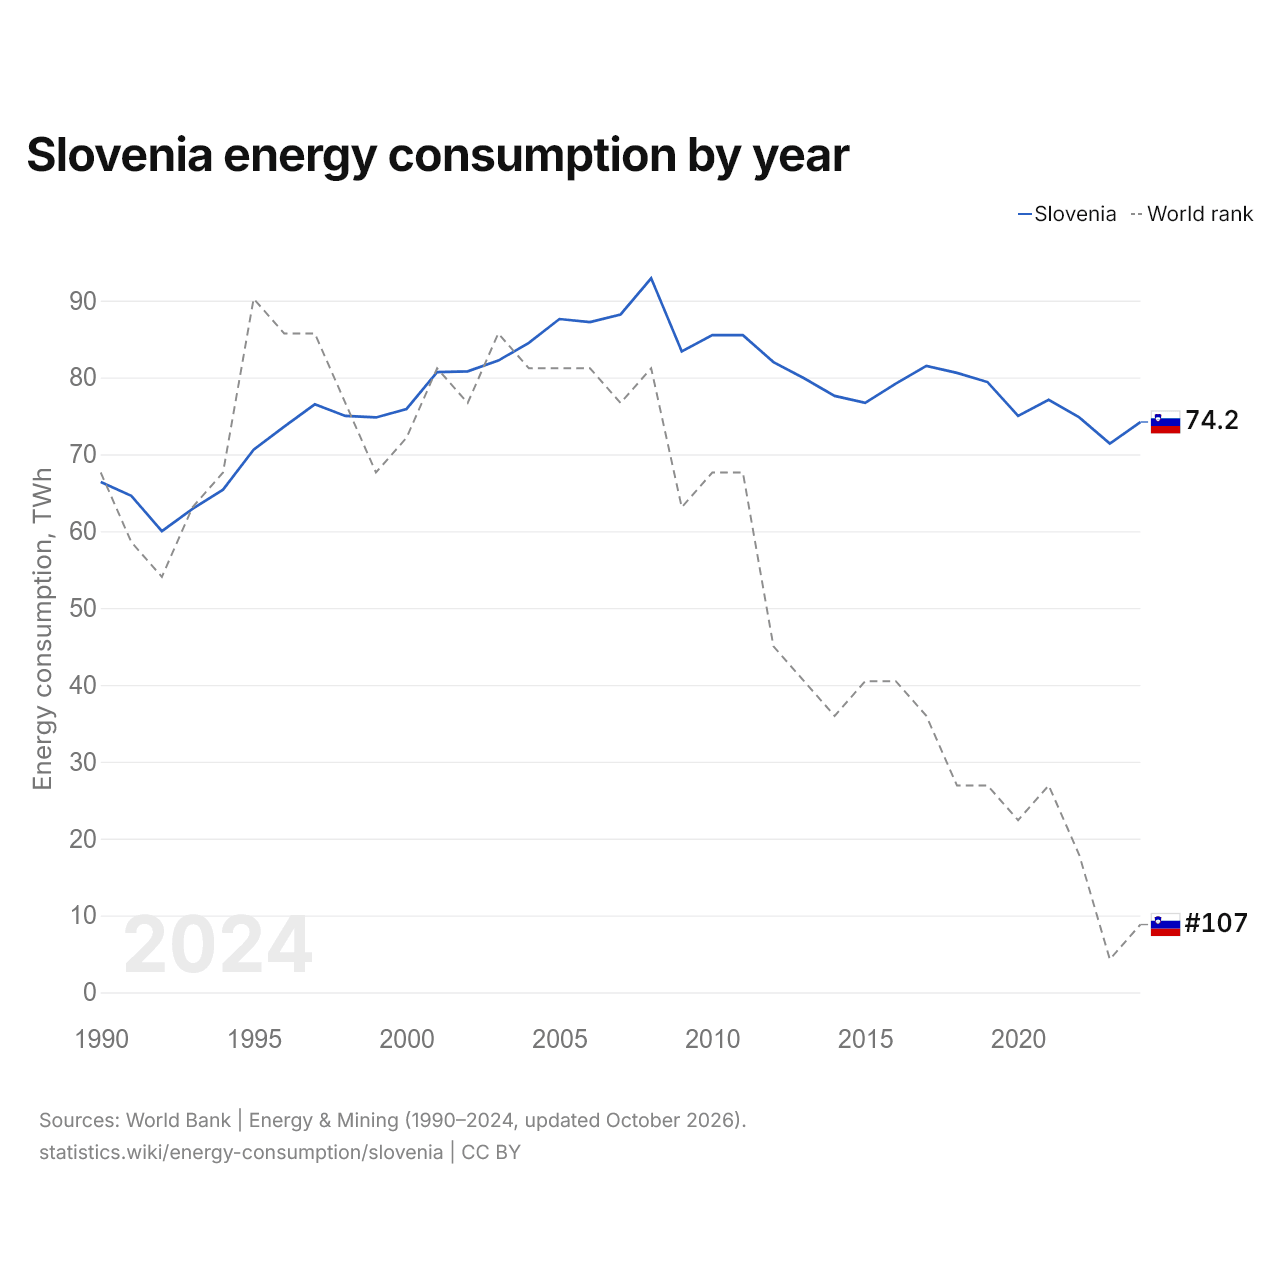
Energy consumption in Slovenia is 74.2 TWh, up from 66.4 TWh in 1990. Its consumption was highest in 2008, at 92.9 TWh. It is the 107th largest energy consumer in the world, up from 108th the year before. Its highest rank was 89th, last held in 1995.
Slovenia's energy consumption is the 30th largest of 40 countries in Europe. Slovenia's electricity consumption was 6,417 kWh per person in 2025, the 30th highest in the world. The renewable share of final energy consumption in Slovenia is 23.4%, the 98th highest in the world.
Slovenia energy consumption per capita by year
| Year | Energy consumption, kWh per person | World rank |
|---|---|---|
| Slovenia | ||
| 2024 | 34,882 | #34 |
| 2023 | 33,656 | #36 |
| 2022 | 35,411 | #34 |
| 2021 | 36,560 | #34 |
| 2020 | 35,690 | #32 |
| 2019 | 37,999 | #32 |
| 2018 | 38,857 | #32 |
| 2017 | 39,433 | #32 |
| 2016 | 38,341 | #32 |
| 2015 | 37,163 | #31 |
| 2014 | 37,642 | #33 |
| 2013 | 38,783 | #32 |
| 2012 | 39,878 | #32 |
| 2011 | 41,643 | #33 |
| 2010 | 41,747 | #32 |
| 2009 | 40,869 | #31 |
| 2008 | 45,963 | #31 |
| 2007 | 43,694 | #31 |
| 2006 | 43,438 | #31 |
| 2005 | 43,774 | #30 |
| 2004 | 42,320 | #32 |
| 2003 | 41,164 | #32 |
| 2002 | 40,526 | #32 |
| 2001 | 40,523 | #33 |
| 2000 | 38,159 | #35 |
| 1999 | 37,710 | #36 |
| 1998 | 37,842 | #35 |
| 1997 | 38,500 | #34 |
| 1996 | 36,986 | #34 |
| 1995 | 35,464 | #37 |
| 1994 | 32,889 | #39 |
| 1993 | 31,580 | #39 |
| 1992 | 30,057 | #41 |
| 1991 | 32,319 | #41 |
| 1990 | 33,233 | #42 |
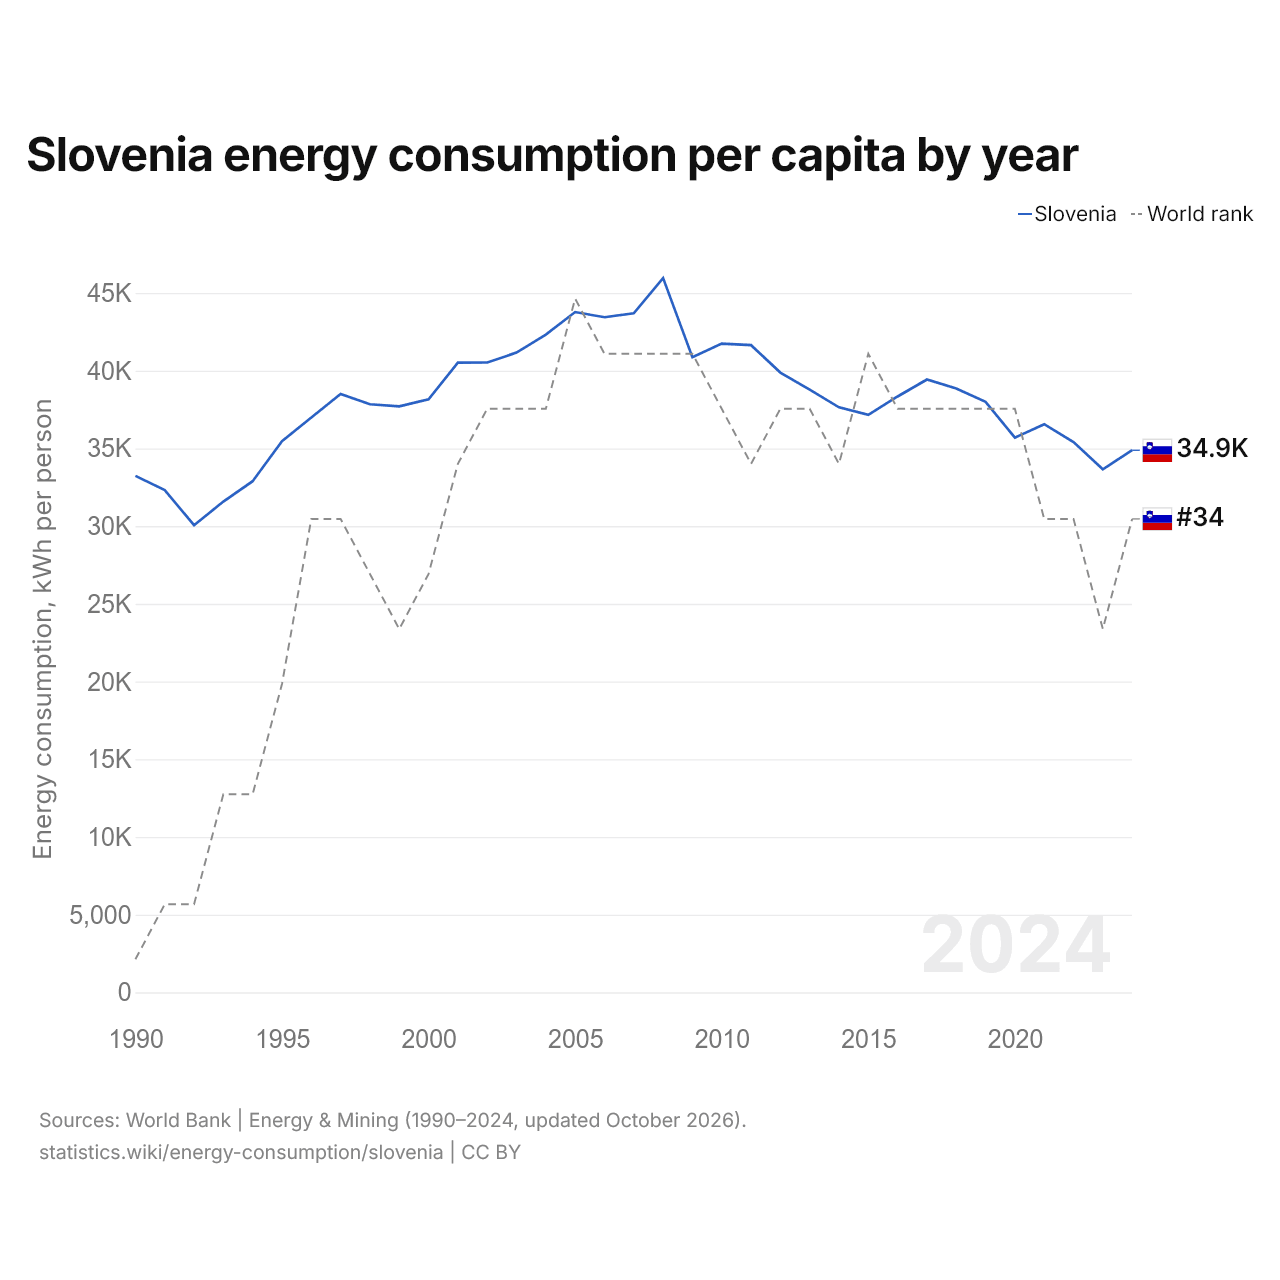
Energy consumption in Slovenia is 34,882 kWh per person, up from 33,233 kWh in 1990. Its consumption per person was highest in 2008, at 45,963 kWh. It is the 34th highest in the world, up from 36th the year before. Its highest rank was 30th, last held in 2005.
Slovenia energy use by source: fossil fuels vs alternative and nuclear, %
| Year | Share of energy use, % | |
|---|---|---|
| Fossil fuels | Alternative and nuclear | |
| 2024 | - | 33.1% |
| 2023 | 57.8% | 32.6% |
| 2022 | 59.2% | 28.2% |
| 2021 | 58.9% | 29.5% |
| 2020 | 58.3% | 33.1% |
| 2019 | 61% | 28.6% |
| 2018 | 61.9% | 28.2% |
| 2017 | 61.3% | 28.8% |
| 2016 | 62.3% | 28.3% |
| 2015 | 60.7% | 28% |
| 2014 | 59.7% | 33.5% |
| 2013 | 63.7% | 26.5% |
| 2012 | 65% | 25.7% |
| 2011 | 64.7% | 26.7% |
| 2010 | 66.5% | 25.7% |
| 2009 | 67.1% | 26.6% |
| 2008 | 67.5% | 24.9% |
| 2007 | 67% | 23.4% |
| 2006 | 67.9% | 23.5% |
| 2005 | 66.4% | 24.4% |
| 2004 | 68% | 24.5% |
| 2003 | 68.3% | 22.9% |
| 2002 | 68.7% | 24.9% |
| 2001 | 68.3% | 24.5% |
| 2000 | 68.9% | 24.1% |
| 1999 | 74.2% | 24% |
| 1998 | 73.5% | 25% |
| 1997 | 74.3% | 23.9% |
| 1996 | 74% | 24.1% |
| 1995 | 72.9% | 25.1% |
| 1994 | 71.7% | 26.5% |
| 1993 | 73.5% | 23.9% |
| 1992 | 72.1% | 25.8% |
| 1991 | 69.5% | 28.8% |
| 1990 | 71.3% | 25.5% |
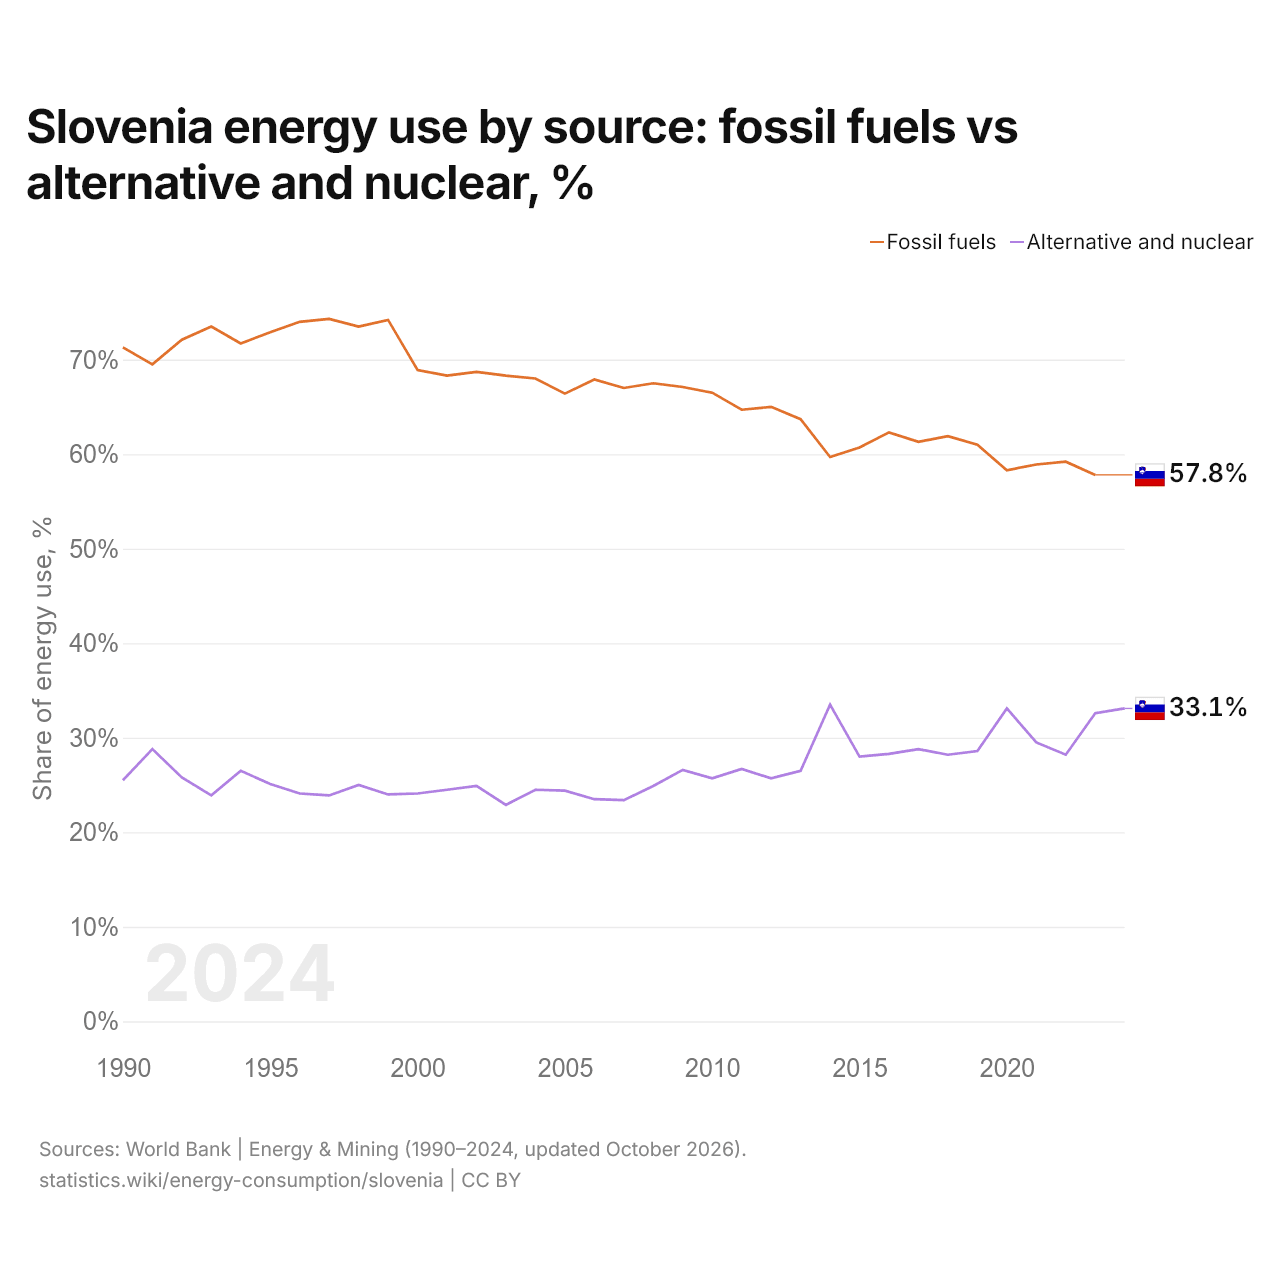
Fossil fuels made up 57.8% of Slovenia's energy use and alternative and nuclear energy 32.6%. In 1990, Slovenia's shares were 71.3% and 25.5%.
Slovenia net energy imports (imports minus exports), % of energy use
| Year | % of energy use |
|---|---|
| Slovenia | |
| 2024 | 46% |
| 2023 | 48.9% |
| 2022 | 53.6% |
| 2021 | 48.7% |
| 2020 | 45.8% |
| 2019 | 52.8% |
| 2018 | 52.2% |
| 2017 | 51.1% |
| 2016 | 49.2% |
| 2015 | 49.1% |
| 2014 | 44.8% |
| 2013 | 47.3% |
| 2012 | 51.5% |
| 2011 | 47.8% |
| 2010 | 48.7% |
| 2009 | 48.3% |
| 2008 | 54.2% |
| 2007 | 51.2% |
| 2006 | 51.1% |
| 2005 | 50.9% |
| 2004 | 51.3% |
| 2003 | 52.4% |
| 2002 | 49.7% |
| 2001 | 48.8% |
| 2000 | 51.8% |
| 1999 | 55.9% |
| 1998 | 52.4% |
| 1997 | 55.4% |
| 1996 | 55.4% |
| 1995 | 50.9% |
| 1994 | 49.2% |
| 1993 | 48.3% |
| 1992 | 41.9% |
| 1991 | 42.2% |
| 1990 | 45.9% |
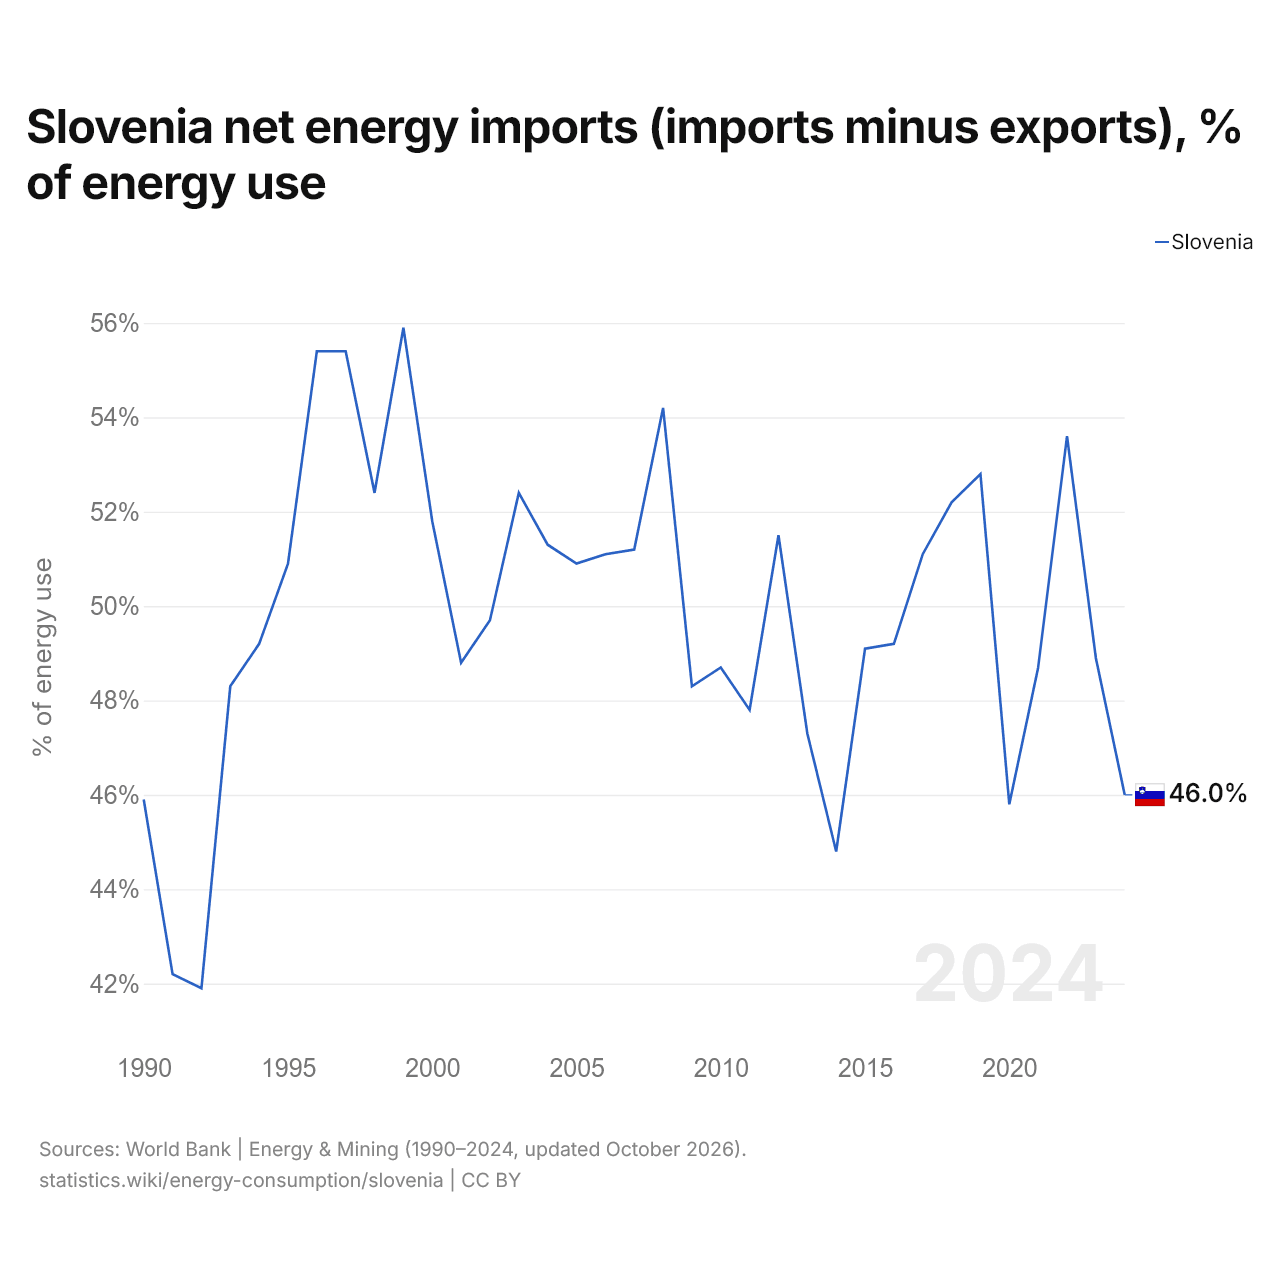
Slovenia's net energy imports equal 46.0% of its energy use; in 1990, its net imports equaled 45.9%.
Slovenia in the world energy consumption ranking







Compare the energy consumption of Slovenia with other countries
Sources:
- World Bank | Energy & Mining (1990–2024, updated October 2026)
Creative Commons Attribution (CC BY): you may copy, share, adapt and reuse this content, also commercially, as long as you credit statistics.wiki and note any changes you made. The sources listed above may have their own license terms.