
List of countries by renewable share of final energy and of electricity
| Rank | Country | Share of final energy | Share of electricity (2025) | Renewable electricity, TWh (2025) |
|---|---|---|---|---|
 World |
19.7% (2020) | 33.7% | 10,783 | |
| 1 |  DR Congo |
96.3% | 100.0% (2024) | 13.6 (2024) |
| 2 |  Somalia |
95.4% (2022) | 39.6% (2024) | 0.22 (2024) |
| 3 |  Liberia |
92.8% (2022) | 55.9% (2024) | 0.33 (2024) |
| 4 |  Gabon |
91.3% | 35.6% (2024) | 0.93 (2024) |
| 5 |  CAR |
90.9% (2022) | 100.0% (2023) | 0.19 (2023) |
| 5 |  Uganda |
90.9% (2022) | 97.2% (2024) | 5.86 (2024) |
| 7 |  Ethiopia |
90.6% | 100.0% | 33.5 |
| 8 |  Guinea-Bissau |
87.4% (2022) | 7.0% (2024) | 0.006 (2024) |
| 9 |  Madagascar |
83.1% (2022) | 48.3% (2024) | 1.31 (2024) |
| 10 |  Burundi |
83.0% (2022) | 76.8% (2024) | 0.4 (2024) |
| 10 |  Zambia |
83.0% | 87.6% (2024) | 17.4 (2024) |
| 12 |  Bhutan |
82.5% (2022) | 100.0% (2024) | 11 (2024) |
| 13 |  Iceland |
82.4% | 100.0% | 18.3 |
| 13 |  Zimbabwe |
82.4% | 58.8% (2024) | 6.27 (2024) |
| 15 |  Eritrea |
80.7% | 16.0% (2024) | 0.08 (2024) |
| 16 |  Nigeria |
80.3% | 36.5% | 16.6 |
| 17 |  Rwanda |
79.9% (2022) | 49.6% (2024) | 0.56 (2024) |
| 18 |  Niger |
79.6% | 13.6% (2024) | 0.14 (2024) |
| 19 |  Cameroon |
79.2% | 74.1% (2024) | 5.57 (2024) |
| 20 |  Tanzania |
78.3% | 36.9% (2024) | 3.47 (2024) |
| 21 |  Mozambique |
76.9% | 83.7% (2024) | 16.9 (2024) |
| 22 |  Haiti |
76.7% | 36.5% (2024) | 0.4 (2024) |
| 23 |  Togo |
75.1% | 42.7% (2024) | 0.37 (2024) |
| 24 |  Nepal |
73.7% | 100.0% (2024) | 11.3 (2024) |
| 25 |  Sierra Leone |
71.6% (2022) | 96.6% (2024) | 0.28 (2024) |
| 26 |  Burkina Faso |
71.4% (2022) | 28.7% (2024) | 0.56 (2024) |
| 26 |  Congo |
71.4% | 20.9% (2024) | 1.14 (2024) |
| 28 |  Mali |
71.1% (2022) | 20.1% (2024) | 1.21 (2024) |
| 29 |  Chad |
70.0% (2022) | 19.5% (2024) | 0.09 (2024) |
| 30 |  Kenya |
67.7% | 90.9% | 13.9 |
| 31 |  Guinea |
66.6% (2022) | 75.6% (2024) | 3.1 (2024) |
| 32 |  Eswatini |
64.7% (2022) | 96.8% (2024) | 0.6 (2024) |
| 33 |  Malawi |
62.9% (2022) | 96.1% (2024) | 1.98 (2024) |
| 33 |  Myanmar |
62.9% | 50.4% (2024) | 11.5 (2024) |
| 35 |  Guatemala |
62.1% | 68.6% (2024) | 10.9 (2024) |
| 36 |  Norway |
61.4% | 99.0% | 159 |
| 37 |  Sudan |
61.0% | 80.0% (2024) | 12 (2024) |
| 38 |  Paraguay |
58.8% | 100.0% | 45.4 |
| 39 |  Ivory Coast |
58.2% | 30.3% (2024) | 3.34 (2024) |
| 40 |  Sweden |
57.9% | 71.3% | 122 |
| 41 |  Uruguay |
57.8% | 97.9% | 11.7 |
| 42 |  Liechtenstein |
56.9% (2022) | n/a | n/a |
| 43 |  Papua New Guinea |
54.6% (2022) | 24.3% (2024) | 1.16 (2024) |
| 44 |  Benin |
54.5% | 19.2% (2024) | 0.23 (2024) |
| 45 |  Angola |
52.9% | 74.1% (2024) | 11.7 (2024) |
| 46 |  Cambodia |
52.4% | 40.9% | 7.26 |
| 47 |  Nicaragua |
50.4% | 63.2% (2024) | 2.92 (2024) |
| 48 |  Finland |
50.2% | 56.4% | 46.5 |
| 49 |  Solomon Islands |
50.1% (2022) | 13.0% (2024) | 0.02 (2024) |
| 50 |  Laos |
49.2% (2022) | 76.7% (2024) | 40.1 (2024) |
| 51 |  Sri Lanka |
48.8% | 58.4% | 10.8 |
| 52 |  Gambia |
47.7% (2022) | 10.7% (2024) | 0.06 (2024) |
| 53 |  Brazil |
46.5% | 86.9% | 663 |
| 54 |  Honduras |
45.9% | 55.4% (2024) | 6.91 (2024) |
| 55 |  Latvia |
44.0% | 73.5% | 4.58 |
| 56 |  Sao Tome |
42.5% (2022) | 14.0% (2023) | 0.01 (2023) |
| 57 |  Albania |
41.9% | 100.0% | 9.06 |
| 57 |  Kiribati |
41.9% (2022) | 28.6% (2024) | 0.01 (2024) |
| 59 |  Pakistan |
41.6% | 46.9% | 80 |
| 60 |  Montenegro |
39.6% | 74.6% | 1.81 |
| 61 |  Denmark |
39.5% | 91.2% | 32.5 |
| 62 |  Comoros |
39.3% (2022) | 6.7% (2023) | 0.01 (2023) |
| 63 |  Ghana |
39.0% | 37.4% (2024) | 9.24 (2024) |
| 64 |  Estonia |
38.0% | 59.8% | 3.67 |
| 65 |  Bosnia |
36.6% | 43.6% | 6.4 |
| 66 |  Austria |
36.0% | 83.6% | 61.3 |
| 67 |  Samoa |
35.9% (2022) | 43.8% (2024) | 0.07 (2024) |
| 68 |  Senegal |
35.4% | 25.2% (2024) | 2.06 (2024) |
| 69 |  India |
34.9% | 24.6% | 514 |
| 69 |  Lesotho |
34.9% (2022) | 100.0% (2024) | 0.06 (2024) |
| 69 |  Tajikistan |
34.9% | 94.4% | 22.7 |
| 72 |  Costa Rica |
34.2% | 100.0% | 12.9 |
| 73 |  Croatia |
34.1% | 76.3% | 11.2 |
| 74 |  Venezuela |
33.7% | 91.1% (2024) | 73 (2024) |
| 75 |  Lithuania |
33.2% | 77.7% | 6.87 |
| 76 |  South Sudan |
32.4% | 7.6% (2024) | 0.05 (2024) |
| 77 |  Portugal |
32.3% | 80.9% | 41.3 |
| 78 |  Belize |
30.8% (2022) | 87.7% (2024) | 0.43 (2024) |
| 79 |  Peru |
30.6% | 64.1% | 39.3 |
| 80 |  Namibia |
30.0% | 98.0% (2024) | 1.94 (2024) |
| 81 |  Colombia |
29.7% | 77.1% | 70.4 |
| 82 |  New Zealand |
28.9% | 88.2% | 39.1 |
| 83 |  Fiji |
28.4% (2022) | 64.2% (2024) | 0.75 (2024) |
| 84 |  Panama |
28.0% | 68.7% (2024) | 9.43 (2024) |
| 84 |  Philippines |
28.0% | 27.0% | 34.9 |
| 86 |  Switzerland |
27.7% | 67.8% | 44.1 |
| 87 |  Kyrgyzstan |
27.6% | 93.5% | 12.1 |
| 88 |  Botswana |
27.4% | 1.9% (2024) | 0.07 (2024) |
| 89 |  Serbia |
27.2% | 28.5% | 10.4 |
| 90 |  Djibouti |
26.9% (2022) | 71.7% (2024) | 0.33 (2024) |
| 91 |  Georgia |
25.2% | 80.6% | 11.5 |
| 92 |  Bangladesh |
25.0% | 3.0% | 3.14 |
| 92 |  Vanuatu |
25.0% (2022) | 24.1% (2023) | 0.02 (2023) |
| 94 |  Chile |
24.2% | 66.4% | 58.7 |
| 94 |  Vietnam |
24.2% | 46.0% | 152 |
| 96 |  Canada |
23.8% | 63.6% | 420 |
| 97 |  Romania |
23.6% | 47.1% | 23.5 |
| 98 |  Slovenia |
23.4% | 39.6% | 5.88 |
| 99 |  El Salvador |
21.9% | 93.6% | 6.52 |
| 100 |  Cape Verde |
21.8% (2022) | 25.8% (2024) | 0.13 (2024) |
| 101 |  Greece |
21.5% | 47.7% | 27.6 |
| 102 |  Moldova |
21.4% | 37.4% | 1.25 |
| 103 |  Cuba |
20.9% | 5.7% (2024) | 1.12 (2024) |
| 104 |  Luxembourg |
20.5% | 92.3% | 1.63 |
| 105 |  Bulgaria |
20.4% | 32.9% | 12.5 |
| 106 |  Indonesia |
20.2% | 15.8% | 83.5 |
| 107 |  Afghanistan |
20.0% (2022) | 92.2% (2024) | 1.54 (2024) |
| 108 |  Mauritania |
19.6% (2022) | 25.6% (2024) | 0.55 (2024) |
| 109 |  North Macedonia |
19.5% | 45.4% | 2.91 |
| 110 |  Spain |
19.0% | 55.8% | 161 |
| 110 |  Thailand |
19.0% | 21.7% | 43.5 |
| 112 |  Ecuador |
18.9% | 79.5% | 29.2 |
| 113 |  Andorra |
18.7% (2022) | 93.3% (2021) | 0.1 (2021) |
| 114 |  Slovakia |
17.9% | 18.7% | 5.43 |
| 115 |  Germany |
17.6% | 58.5% | 291 |
| 116 |  Italy |
17.5% | 48.7% | 129 |
| 117 |  Czech Republic |
17.2% | 16.9% | 12.8 |
| 118 |  France |
16.2% | 26.6% | 153 |
| 119 |  Cyprus |
15.6% | 25.1% | 1.45 |
| 120 |  Palestine |
15.4% (2022) | 43.0% (2024) | 0.45 (2024) |
| 121 |  Hungary |
15.3% | 35.3% | 14.2 |
| 122 |  China |
15.2% | 36.5% | 3,830 |
| 122 |  Poland |
15.2% | 31.2% | 53.9 |
| 124 |  Dominican Republic |
14.8% | 30.1% | 7.45 |
| 125 |  North Korea |
14.7% | 63.4% (2024) | 17.2 (2024) |
| 126 |  Suriname |
14.5% | 53.2% (2024) | 0.93 (2024) |
| 127 |  Mexico |
13.0% | 21.6% | 84.1 |
| 128 |  Bolivia |
12.8% | 36.1% | 4.92 |
| 129 |  Ireland |
12.7% | 47.8% | 14.9 |
| 130 |  Australia |
12.3% | 39.8% | 114 |
| 131 |  Marshall Islands |
12.2% (2022) | 2.4% (2021) | 0.002 (2021) |
| 131 |  Netherlands |
12.2% | 51.2% | 69.2 |
| 131 |  United Kingdom |
12.2% | 51.8% | 152 |
| 134 |  Guyana |
12.1% (2022) | 5.2% (2024) | 0.07 (2024) |
| 135 |  Turkey |
12.0% | 43.3% | 153 |
| 136 |  Belgium |
11.7% | 38.6% | 27.8 |
| 137 |  Tunisia |
11.6% | 7.0% | 1.6 |
| 138 |  Jordan |
11.5% | 30.3% (2024) | 7.83 (2024) |
| 139 |  East Timor |
11.4% (2022) | 0.4% (2021) | 0.002 (2021) |
| 140 |  Morocco |
10.9% | 26.8% | 12.4 |
| 140 |  United States |
10.9% | 25.6% | 1,159 |
| 142 |  Jamaica |
10.5% | 14.8% (2024) | 0.75 (2024) |
| 143 |  Grenada |
10.0% (2022) | 4.0% (2024) | 0.01 (2024) |
| 144 |  Saint Lucia |
9.7% (2022) | 2.0% (2024) | 0.008 (2024) |
| 144 |  South Africa |
9.7% | 13.6% | 33.1 |
| 146 |  Argentina |
9.2% | 34.0% | 52.3 |
| 147 |  Armenia |
9.1% | 29.7% | 2.56 |
| 148 |  Dominica |
8.9% (2022) | 18.8% (2023) | 0.03 (2023) |
| 148 |  Ukraine |
8.9% | 16.4% (2022) | 18.3 (2022) |
| 150 |  Japan |
8.8% | 23.9% | 245 |
| 151 |  Malta |
8.6% | 16.5% | 0.37 |
| 151 |  Mauritius |
8.6% | 19.6% (2024) | 0.68 (2024) |
| 153 |  Belarus |
8.2% | 3.0% | 1.38 |
| 154 |  Malaysia |
7.5% | 21.0% | 44.6 |
| 155 |  Lebanon |
6.8% | 43.3% (2024) | 2.29 (2024) |
| 156 |  Israel |
6.2% | 16.9% | 13.9 |
| 157 |  Egypt |
6.1% | 13.8% | 33.3 |
| 158 |  Barbados |
5.5% (2022) | 17.8% (2024) | 0.22 (2024) |
| 159 |  Tuvalu |
5.2% (2022) | 15.8% (2021) | 0.002 (2021) |
| 160 |  Saint Vincent |
5.1% (2022) | 19.8% (2024) | 0.03 (2024) |
| 161 |  Equatorial Guinea |
4.2% (2022) | 27.1% (2024) | 0.41 (2024) |
| 162 |  Yemen |
3.7% | 17.8% (2024) | 1.01 (2024) |
| 163 |  South Korea |
3.6% | 10.5% | 65.6 |
| 164 |  Russia |
3.5% | 17.4% | 208 |
| 165 |  Libya |
3.1% | 2.7% (2024) | 0.94 (2024) |
| 166 |  Mongolia |
3.0% | 10.3% | 1.06 |
| 167 |  Curacao |
2.8% | 18.3% (2021) | 0.15 (2021) |
| 168 |  Tonga |
2.3% (2022) | 26.8% (2024) | 0.02 (2024) |
| 169 |  Kazakhstan |
2.0% | 14.3% | 17.8 |
| 170 |  Nauru |
1.9% (2022) | 24.5% (2024) | 0.01 (2024) |
| 170 |  Seychelles |
1.9% (2022) | 6.7% (2024) | 0.04 (2024) |
| 172 |  Saint Kitts |
1.5% (2022) | 7.1% (2024) | 0.02 (2024) |
| 173 |  Azerbaijan |
1.3% | 12.3% | 3.48 |
| 174 |  Maldives |
1.2% (2022) | 11.2% (2024) | 0.1 (2024) |
| 175 |  Bahamas |
1.1% (2022) | 2.1% (2024) | 0.05 (2024) |
| 175 |  Iraq |
1.1% | 1.7% (2024) | 2.61 (2024) |
| 175 |  Singapore |
1.1% | 5.5% | 3.32 |
| 175 |  Syria |
1.1% | 10.7% (2024) | 2.89 (2024) |
| 179 |  UAE |
1.0% | 10.4% | 19.2 |
| 179 |  Uzbekistan |
1.0% | 19.7% | 17.1 |
| 181 |  Antigua |
0.9% (2022) | 7.4% (2024) | 0.03 (2024) |
| 181 |  Iran |
0.9% | 3.9% | 15.4 |
| 181 |  Palau |
0.9% (2022) | 4.6% (2021) | 0.004 (2021) |
| 184 |  Trinidad |
0.5% | 0.4% (2024) | 0.04 (2024) |
| 185 |  Algeria |
0.1% | 1.0% (2024) | 0.97 (2024) |
| 185 |  Kuwait |
0.1% | 2.4% | 2.11 |
| 185 |  Oman |
0.1% | 11.9% | 6.61 |
| 185 |  Saudi Arabia |
0.1% | 4.8% | 23 |
| 185 |  Turkmenistan |
0.1% | 0.1% (2024) | 0.02 (2024) |
| 190 |  Bahrain |
0.0% | 0.3% (2024) | 0.1 (2024) |
| 190 |  Brunei |
0.0% | 0.2% (2024) | 0.009 (2024) |
| 190 |  Cayman Islands |
0.0% (2022) | 3.3% (2024) | 0.02 (2024) |
| 190 |  Qatar |
0.0% | 4.0% (2024) | 2.28 (2024) |
The list ranks 193 countries by their latest renewable share of final energy consumption, from the DR Congo (96.3%) to Qatar (0.0%). Renewables make up 19.7% of the world's final energy consumption. Half of the countries get less than 23.6% of their final energy from renewables. Renewables produced 33.7% of the world's electricity in 2025.
Renewable energy comes from hydropower, wind, solar, geothermal and bioenergy, including the wood and charcoal burned for cooking and heating. The pages give two measures: the renewable share of final energy consumption, all the energy households, businesses and transport use as fuels, heat and electricity, and the renewable share of electricity production. A country can produce most of its electricity from renewables and still run its cars and heating mostly on fossil fuels, so the two shares can differ widely. The latest figures are from 2021 or 2022 for the share of final energy and from 2025 for the share of electricity.
Renewable share of final energy consumption by country map
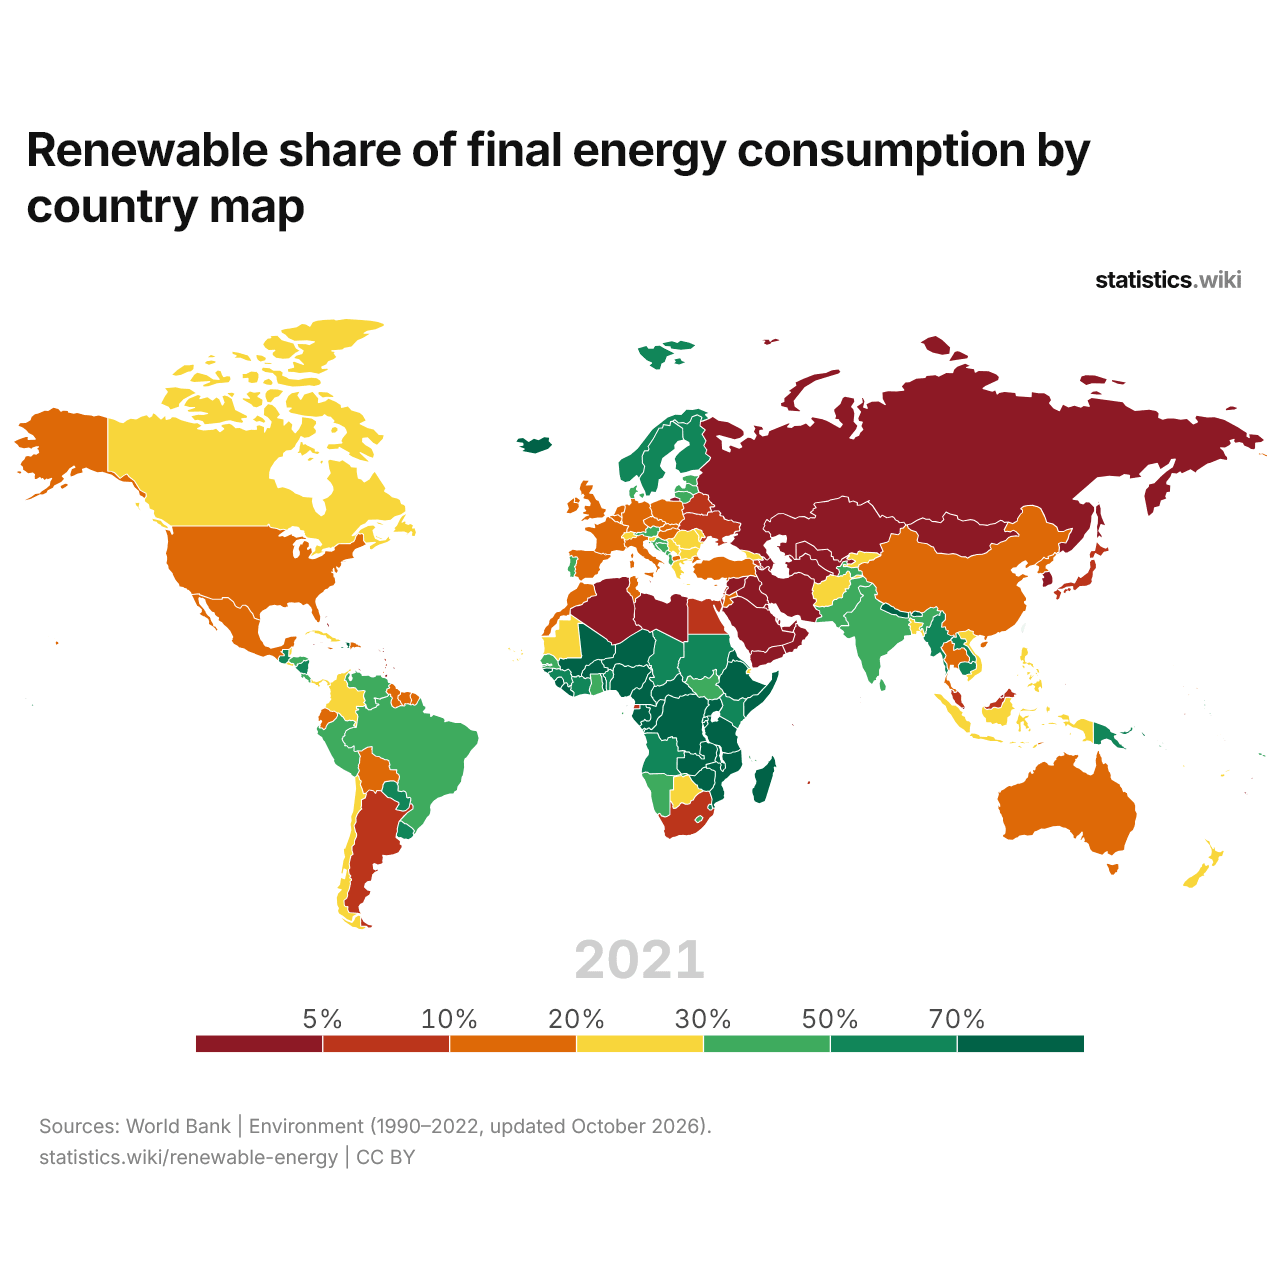
Renewables make up more than 50% of final energy consumption in 49 countries and less than 10% in 50; in 1990, the numbers were 64 and 67.
Renewable share of electricity production by country map
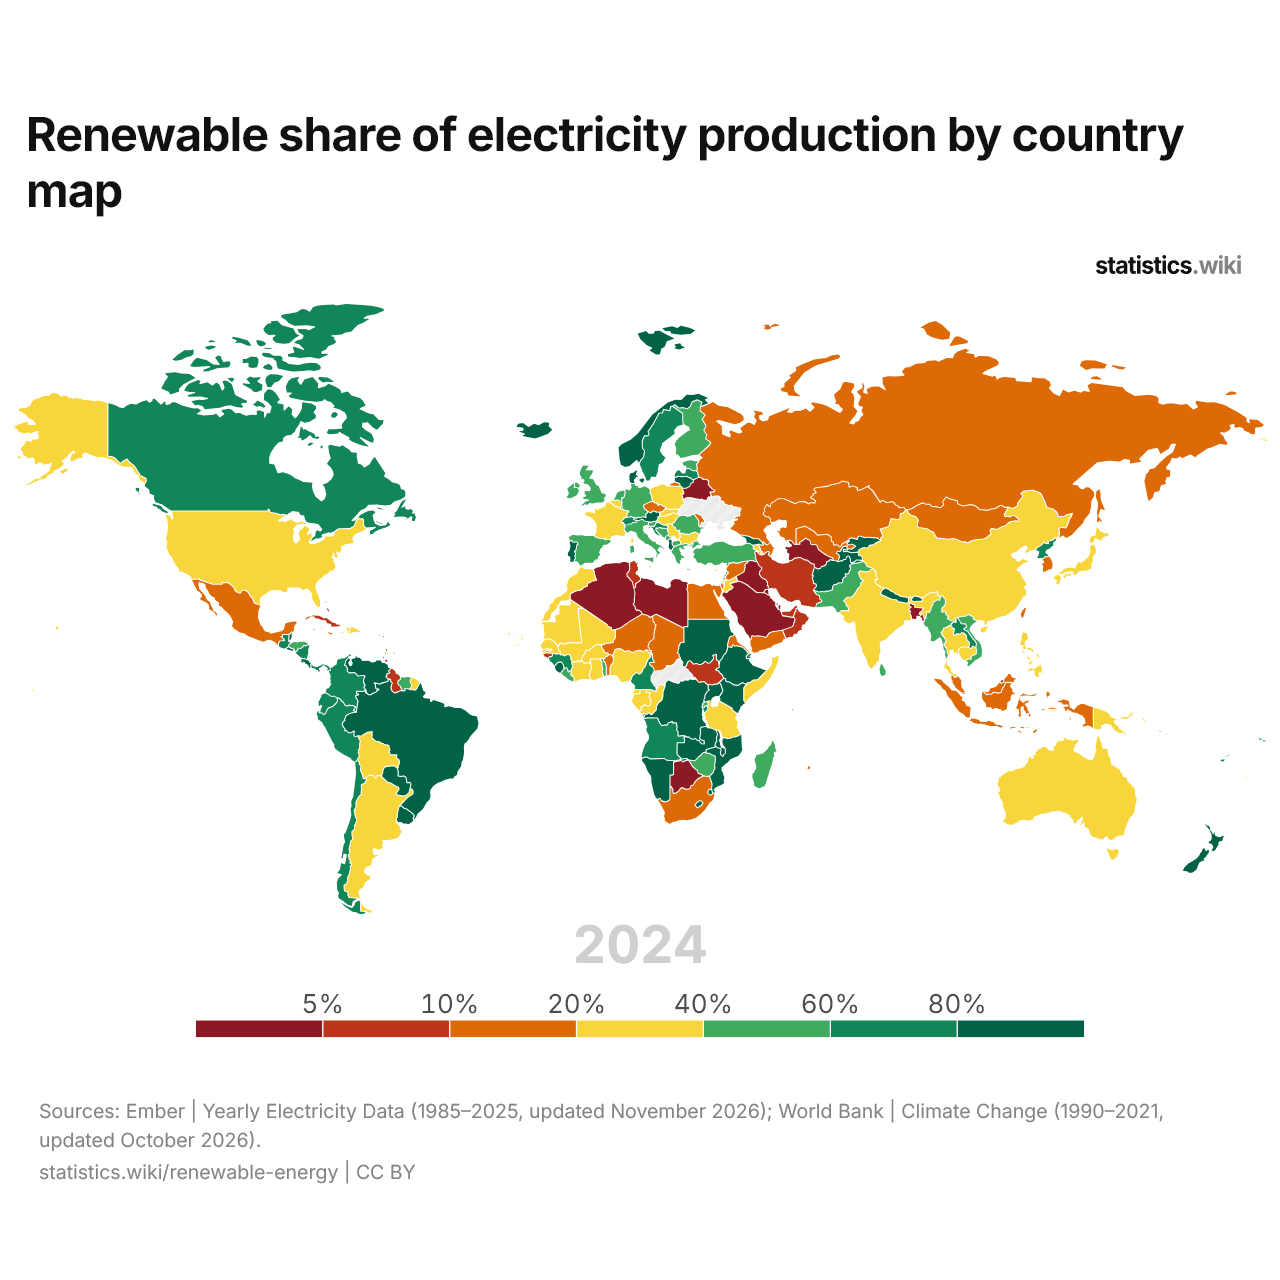
Renewables produce more than 80% of the electricity in 34 countries and less than 10% in 29; in 2000, the numbers were 28 and 86.
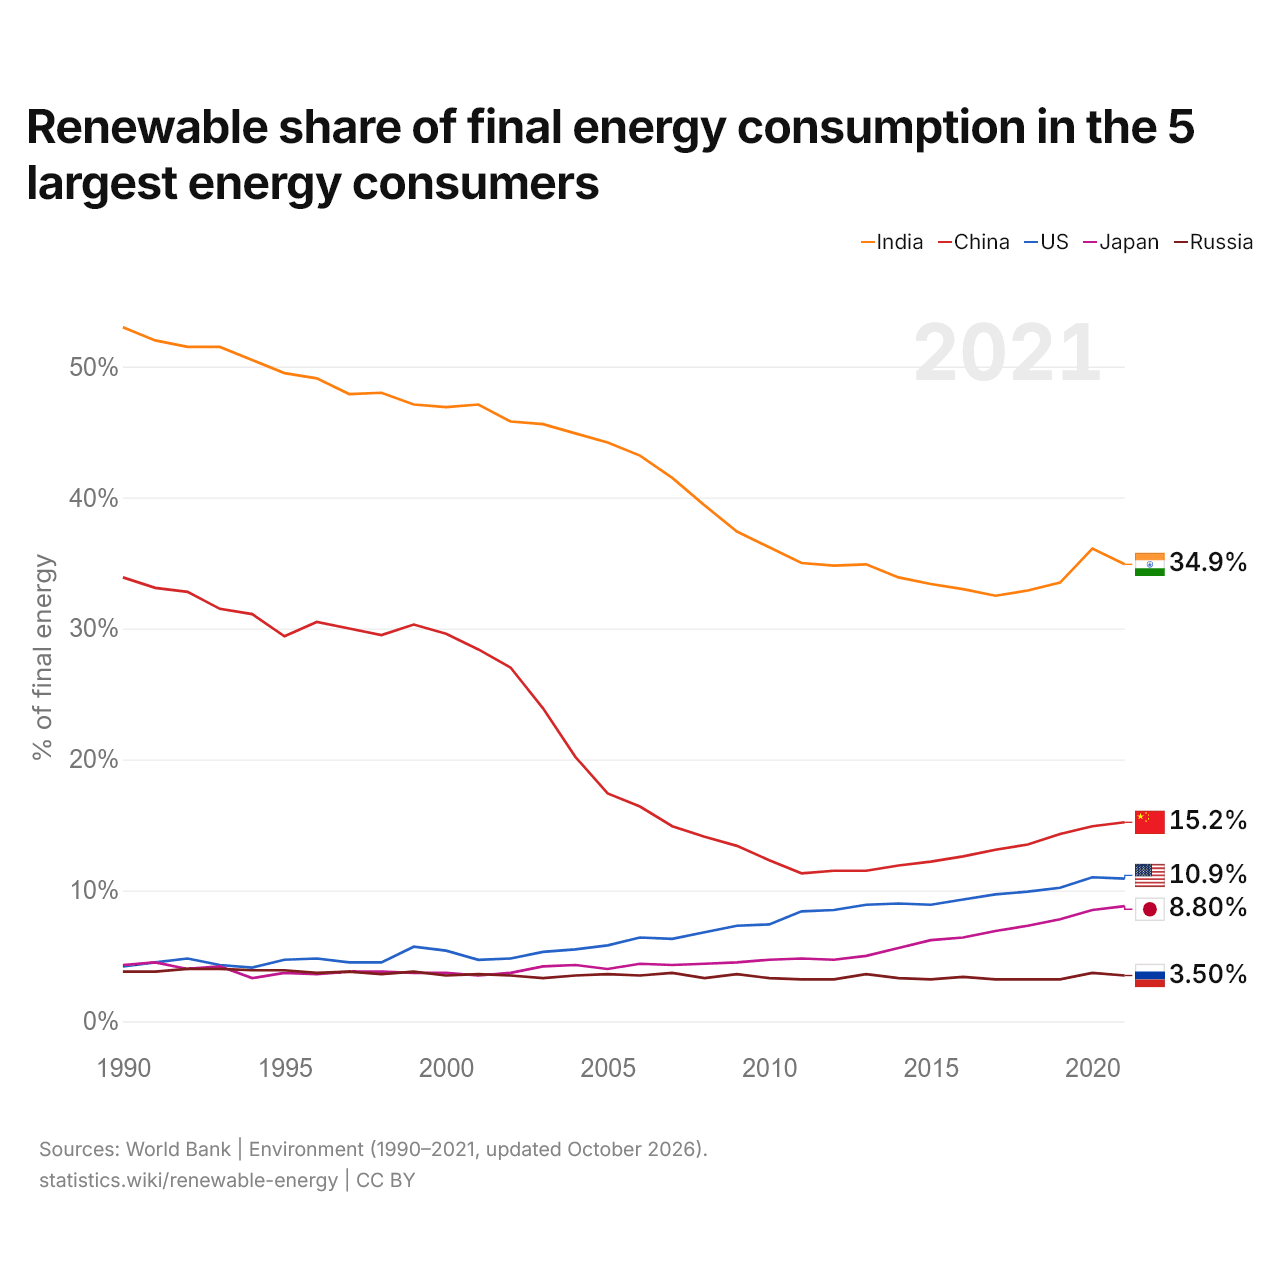
Renewable share of final energy consumption in the 5 largest energy consumers
| Year | % of final energy | ||||
|---|---|---|---|---|---|
| India | China | United States | Japan | Russia | |
| 2021 | 34.9% | 15.2% | 10.9% | 8.8% | 3.5% |
| 2020 | 36.1% | 14.9% | 11% | 8.5% | 3.7% |
| 2019 | 33.5% | 14.3% | 10.2% | 7.8% | 3.2% |
| 2018 | 32.9% | 13.5% | 9.9% | 7.3% | 3.2% |
| 2017 | 32.5% | 13.1% | 9.7% | 6.9% | 3.2% |
| 2016 | 33% | 12.6% | 9.3% | 6.4% | 3.4% |
| 2015 | 33.4% | 12.2% | 8.9% | 6.2% | 3.2% |
| 2014 | 33.9% | 11.9% | 9% | 5.6% | 3.3% |
| 2013 | 34.9% | 11.5% | 8.9% | 5% | 3.6% |
| 2012 | 34.8% | 11.5% | 8.5% | 4.7% | 3.2% |
| 2011 | 35% | 11.3% | 8.4% | 4.8% | 3.2% |
| 2010 | 36.2% | 12.3% | 7.4% | 4.7% | 3.3% |
| 2009 | 37.4% | 13.4% | 7.3% | 4.5% | 3.6% |
| 2008 | 39.4% | 14.1% | 6.8% | 4.4% | 3.3% |
| 2007 | 41.5% | 14.9% | 6.3% | 4.3% | 3.7% |
| 2006 | 43.2% | 16.4% | 6.4% | 4.4% | 3.5% |
| 2005 | 44.2% | 17.4% | 5.8% | 4% | 3.6% |
| 2004 | 44.9% | 20.2% | 5.5% | 4.3% | 3.5% |
| 2003 | 45.6% | 23.9% | 5.3% | 4.2% | 3.3% |
| 2002 | 45.8% | 27% | 4.8% | 3.7% | 3.5% |
| 2001 | 47.1% | 28.4% | 4.7% | 3.5% | 3.6% |
| 2000 | 46.9% | 29.6% | 5.4% | 3.7% | 3.5% |
| 1999 | 47.1% | 30.3% | 5.7% | 3.7% | 3.8% |
| 1998 | 48% | 29.5% | 4.5% | 3.8% | 3.6% |
| 1997 | 47.9% | 30% | 4.5% | 3.8% | 3.8% |
| 1996 | 49.1% | 30.5% | 4.8% | 3.6% | 3.7% |
| 1995 | 49.5% | 29.4% | 4.7% | 3.7% | 3.9% |
| 1994 | 50.5% | 31.1% | 4.1% | 3.3% | 3.9% |
| 1993 | 51.5% | 31.5% | 4.3% | 4.2% | 4% |
| 1992 | 51.5% | 32.8% | 4.8% | 4% | 4% |
| 1991 | 52% | 33.1% | 4.5% | 4.5% | 3.8% |
| 1990 | 53% | 33.9% | 4.2% | 4.3% | 3.8% |
Renewables make up 34.9% of final energy consumption in India, 15.2% in China, 10.9% in the United States, 8.8% in Japan and 3.5% in Russia. India's renewable share has been the highest of the five every year since 1990. The most recent change in their order came in 2002, when Japan's renewable share passed Russia's.
11 countries with the highest renewable share of final energy consumption
10 countries with the lowest renewable share of final energy consumption
Of the eleven countries with the highest renewable shares of final energy consumption, all are in Africa; of the eleven with the lowest, seven are in Asia.
10 largest producers of renewable electricity, TWh (2025)
China produced the most renewable electricity in 2025, 3,830 TWh, followed by the United States (1,159 TWh) and Brazil (663 TWh). The ten largest producers generated 71% of the world's renewable electricity.
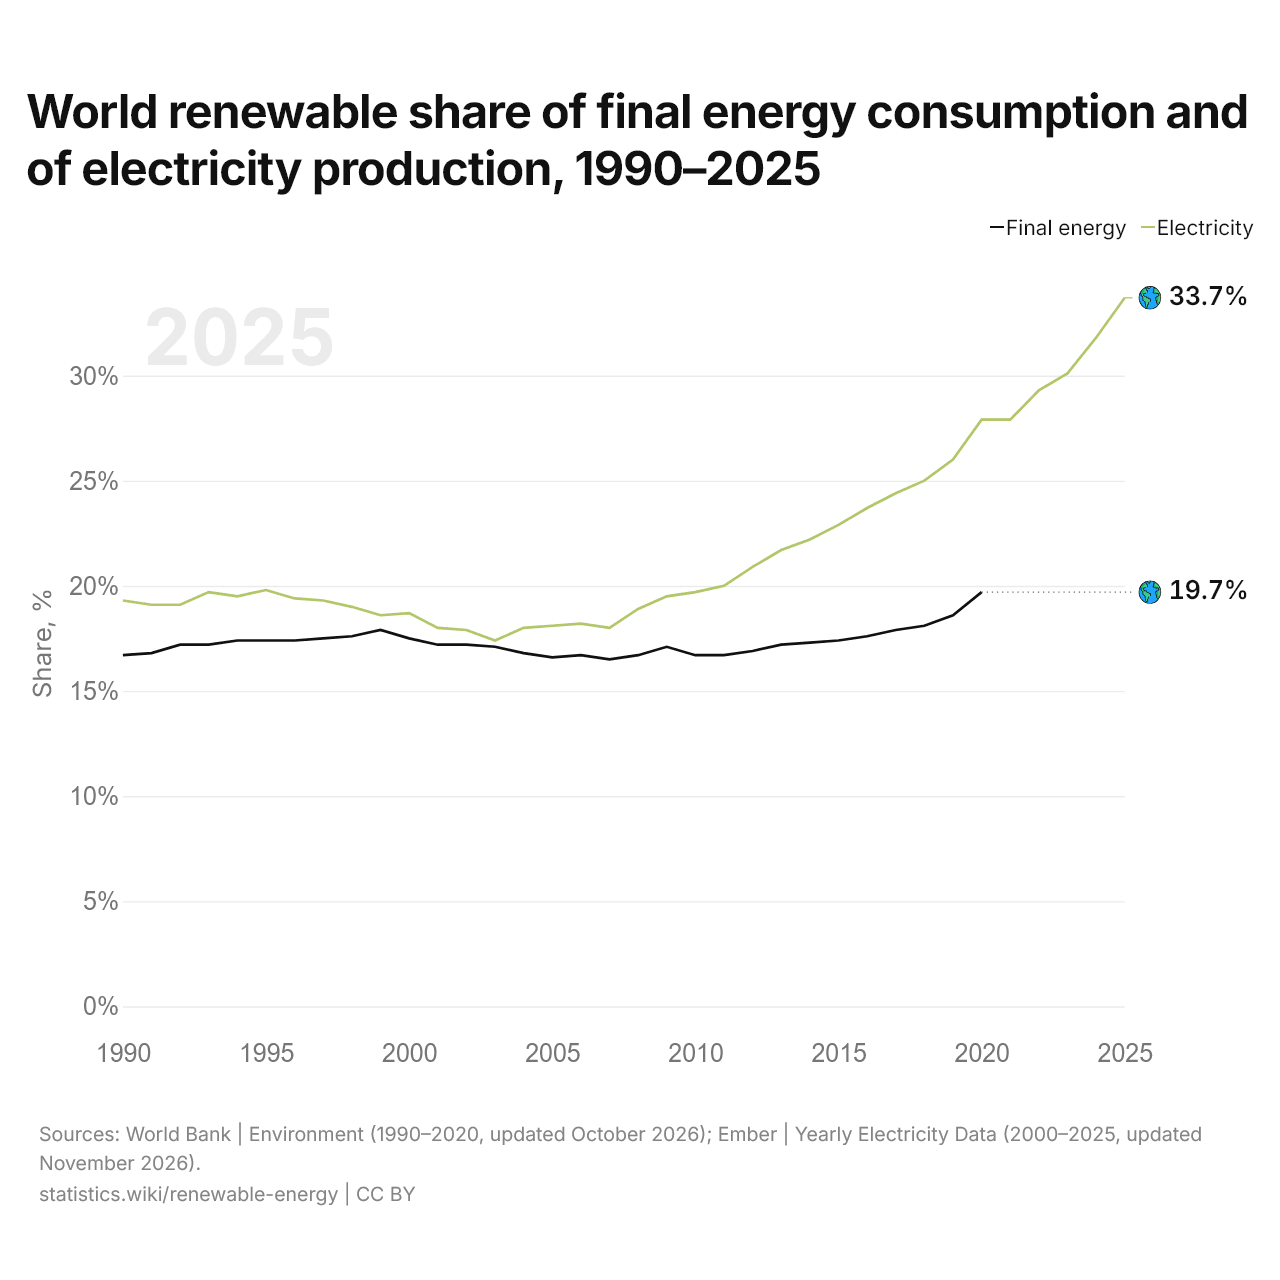
World renewable share of final energy consumption and of electricity production, 1990–2025
| Year | Share, % | |
|---|---|---|
| Final energy | Electricity | |
| 2025 | - | 33.7% |
| 2024 | - | 31.8% |
| 2023 | - | 30.1% |
| 2022 | - | 29.3% |
| 2021 | - | 27.9% |
| 2020 | 19.7% | 27.9% |
| 2019 | 18.6% | 26% |
| 2018 | 18.1% | 25% |
| 2017 | 17.9% | 24.4% |
| 2016 | 17.6% | 23.7% |
| 2015 | 17.4% | 22.9% |
| 2014 | 17.3% | 22.2% |
| 2013 | 17.2% | 21.7% |
| 2012 | 16.9% | 20.9% |
| 2011 | 16.7% | 20% |
| 2010 | 16.7% | 19.7% |
| 2009 | 17.1% | 19.5% |
| 2008 | 16.7% | 18.9% |
| 2007 | 16.5% | 18% |
| 2006 | 16.7% | 18.2% |
| 2005 | 16.6% | 18.1% |
| 2004 | 16.8% | 18% |
| 2003 | 17.1% | 17.4% |
| 2002 | 17.2% | 17.9% |
| 2001 | 17.2% | 18% |
| 2000 | 17.5% | 18.7% |
| 1999 | 17.9% | 18.6% |
| 1998 | 17.6% | 19% |
| 1997 | 17.5% | 19.3% |
| 1996 | 17.4% | 19.4% |
| 1995 | 17.4% | 19.8% |
| 1994 | 17.4% | 19.5% |
| 1993 | 17.2% | 19.7% |
| 1992 | 17.2% | 19.1% |
| 1991 | 16.8% | 19.1% |
| 1990 | 16.7% | 19.3% |
Renewables made up 19.7% of the world's final energy consumption and produced 27.9% of its electricity. In 1990, the shares were 16.7% and 19.3%.
Compare the renewable energy of any 2 countries
Sources:
- World Bank | Environment (1990–2022, updated October 2026)
- Ember | Yearly Electricity Data (1985–2025, updated November 2026)
Creative Commons Attribution (CC BY): you may copy, share, adapt and reuse this content, also commercially, as long as you credit statistics.wiki and note any changes you made. The sources listed above may have their own license terms.