
List of countries by nuclear share of electricity, with output in TWh (2025)
| Rank | Country | Share of electricity | TWh |
|---|---|---|---|
 World |
8.8% | 2,805 | |
| 1 |  France |
68.3% | 392 |
| 2 |  Slovakia |
66.4% | 19.3 |
| 3 |  Ukraine |
51.0% (2024) | 62.2 (2022) |
| 4 |  Czech Republic |
42.3% | 31.9 |
| 5 |  Hungary |
40.1% | 16.1 |
| 6 |  Finland |
39.8% | 32.8 |
| 7 |  Slovenia |
39.3% | 5.84 |
| 8 |  Bulgaria |
39.0% | 14.9 |
| 9 |  Belarus |
37.3% | 17 |
| 10 |  Belgium |
33.5% | 24.1 |
| 11 |  Armenia |
31.0% | 2.66 |
| 12 |  Switzerland |
29.9% | 19.4 |
| 13 |  South Korea |
29.4% | 185 |
| 14 |  Sweden |
27.4% | 46.7 |
| 15 |  UAE |
21.2% | 39.1 |
| 16 |  Romania |
20.5% | 10.2 |
| 17 |  Spain |
18.8% | 54.1 |
| 18 |  Russia |
18.3% | 219 |
| 19 |  United States |
17.4% | 785 |
| 20 |  Pakistan |
14.1% | 24 |
| 21 |  Canada |
12.8% | 84.8 |
| 22 |  United Kingdom |
12.4% | 36.4 |
| 23 |  Japan |
9.2% | 94.1 |
| 24 |  Argentina |
7.0% | 10.8 |
| 25 |  China |
4.6% | 485 |
| 26 |  South Africa |
4.2% | 10.2 |
| 27 |  Netherlands |
3.0% | 3.99 |
| 28 |  Mexico |
2.6% | 10.1 |
| 29 |  India |
2.6% | 53.8 |
| 30 |  Brazil |
2.1% | 15.8 |
| 31 |  Iran |
1.4% | 5.39 |
| 32 |  Taiwan |
1.1% | 3.24 |
The list ranks 32 countries by the latest share of their electricity produced from nuclear power, from France (68.3%) to Taiwan (1.1%). Nuclear power produced 8.8% of the world's electricity in 2025. Half of these countries produced less than 19.6% of their electricity from nuclear power.
Nuclear power is electricity generated by the heat of nuclear fission in reactors. The pages give its share of a country's electricity production, the measure the list ranks, and the electricity it produced in terawatt-hours (TWh, a billion kilowatt-hours). The list includes only the countries with nuclear electricity in their latest figures; most countries have no reactors.
Nuclear power share of electricity production by country map
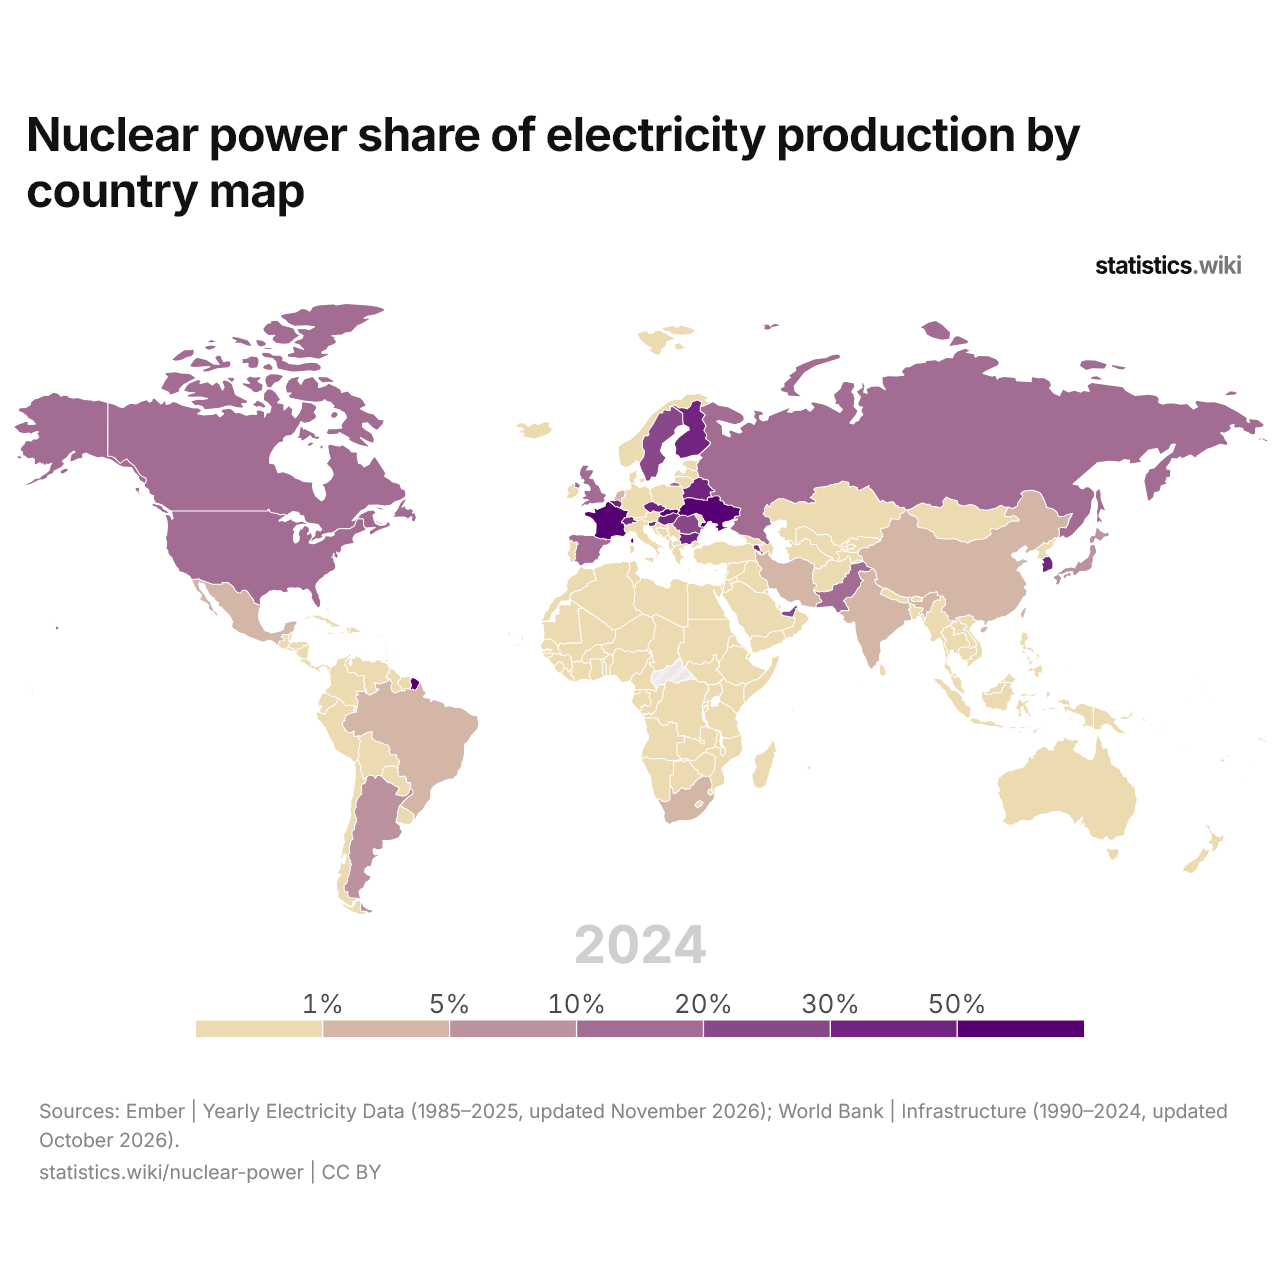
Nuclear power produces more than 50% of the electricity in 3 countries and less than 1%, or none, in 150 (2024); in 2000, the numbers were 4 and 160.
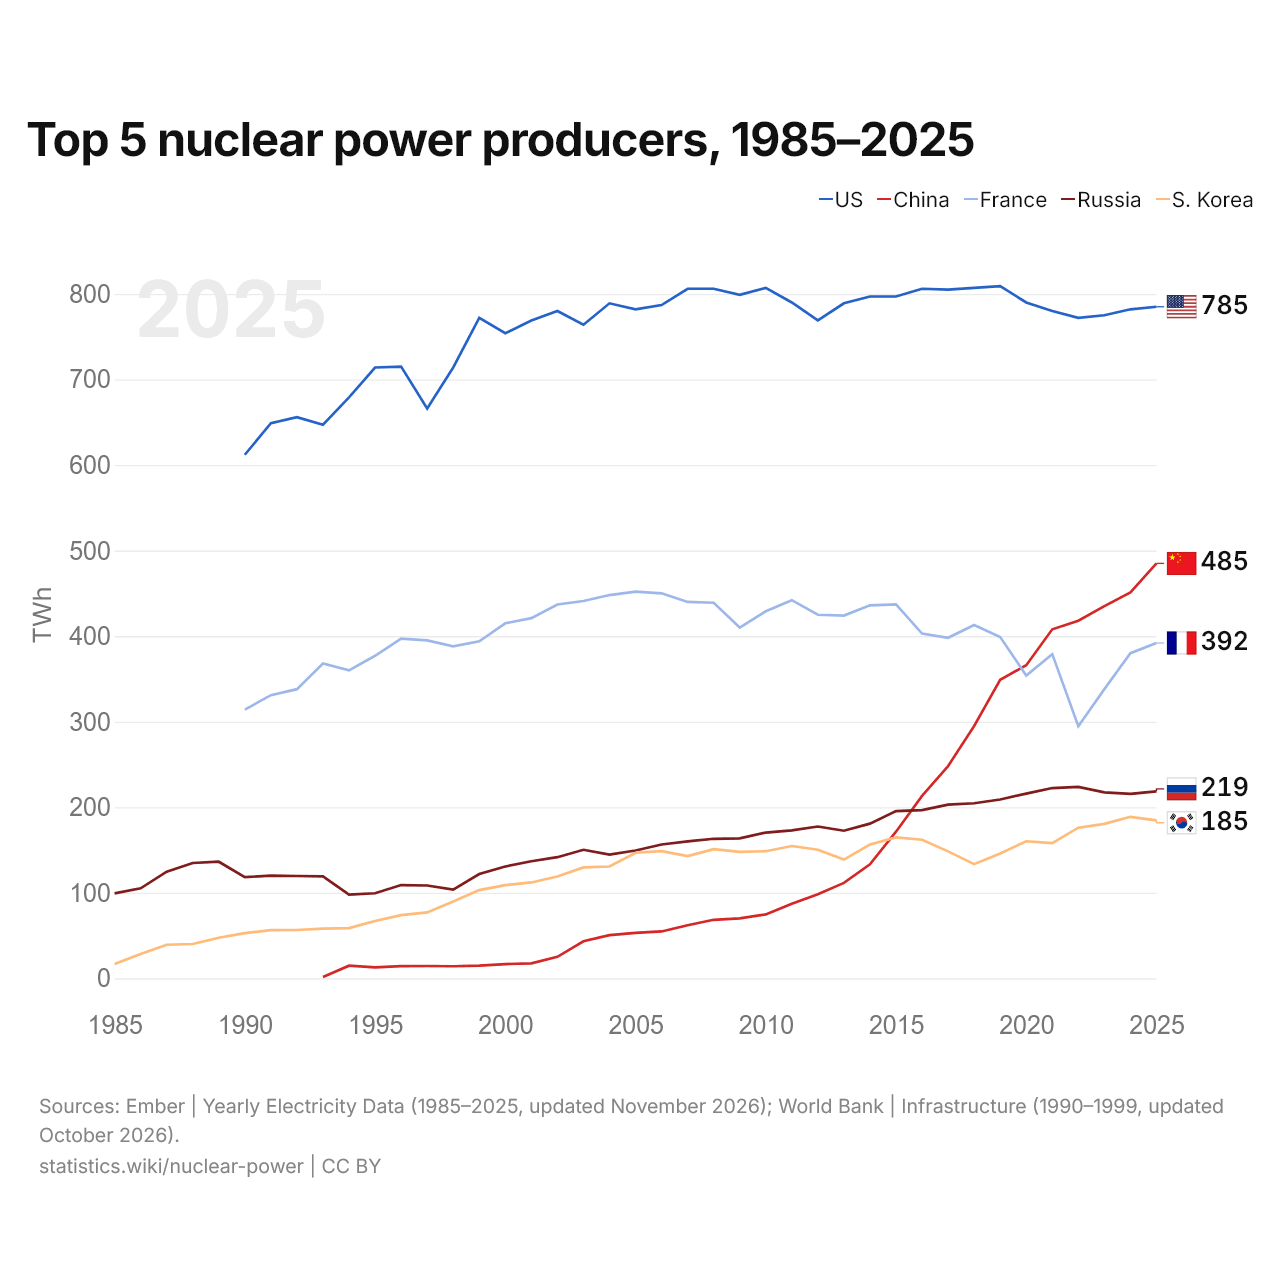
Top 5 nuclear power producers, 1985–2025
| Year | TWh | ||||
|---|---|---|---|---|---|
| United States | China | France | Russia | South Korea | |
| 2025 | 785 | 485 | 392 | 218.6 | 184.7 |
| 2024 | 782 | 451 | 380 | 215.7 | 188.8 |
| 2023 | 775 | 435 | 338 | 217.4 | 180.5 |
| 2022 | 772 | 418 | 294.7 | 223.7 | 176.1 |
| 2021 | 780 | 408 | 379 | 222.4 | 158 |
| 2020 | 790 | 366 | 354 | 215.9 | 160.2 |
| 2019 | 809 | 349 | 399 | 209 | 145.9 |
| 2018 | 807 | 295 | 413 | 204.6 | 133.5 |
| 2017 | 805 | 248.1 | 398 | 203.1 | 148.4 |
| 2016 | 806 | 213.2 | 403 | 196.6 | 162 |
| 2015 | 797 | 171.4 | 437 | 195.5 | 164.8 |
| 2014 | 797 | 133.2 | 436 | 180.8 | 156.4 |
| 2013 | 789 | 111.5 | 424 | 172.5 | 138.8 |
| 2012 | 769 | 98.3 | 425 | 177.5 | 150.3 |
| 2011 | 790 | 87.2 | 442 | 172.9 | 154.7 |
| 2010 | 807 | 74.7 | 429 | 170.4 | 148.6 |
| 2009 | 799 | 70.1 | 410 | 163.6 | 147.8 |
| 2008 | 806 | 68.4 | 439 | 163.1 | 151 |
| 2007 | 806 | 62.1 | 440 | 160.1 | 142.9 |
| 2006 | 787 | 54.8 | 450 | 156.4 | 148.7 |
| 2005 | 782 | 53.1 | 452 | 149.4 | 146.8 |
| 2004 | 789 | 50.5 | 448 | 144.7 | 130.7 |
| 2003 | 764 | 43.3 | 441 | 150.3 | 129.7 |
| 2002 | 780 | 25.1 | 437 | 141.6 | 119.1 |
| 2001 | 769 | 17.5 | 421 | 136.9 | 112.1 |
| 2000 | 754 | 16.7 | 415 | 130.7 | 109 |
| 1999 | 772 | 14.9 | 394 | 121.9 | 103.1 |
| 1998 | 714 | 14.1 | 388 | 103.7 | 89.7 |
| 1997 | 666 | 14.4 | 395 | 108.5 | 77.1 |
| 1996 | 715 | 14.3 | 397 | 109 | 73.9 |
| 1995 | 714 | 12.8 | 377 | 99.5 | 67 |
| 1994 | 679 | 14.8 | 360 | 97.8 | 58.7 |
| 1993 | 647 | 1.6 | 368 | 119.2 | 58.1 |
| 1992 | 656 | - | 338 | 119.6 | 56.5 |
| 1991 | 649 | - | 331 | 120 | 56.3 |
| 1990 | 612 | - | 314 | 118.3 | 52.9 |
| 1989 | - | - | - | 136.3 | 47.4 |
| 1988 | - | - | - | 134.8 | 40.1 |
| 1987 | - | - | - | 124.7 | 39.3 |
| 1986 | - | - | - | 105.2 | 28.3 |
| 1985 | - | - | - | 99.3 | 16.7 |
In 2025, nuclear power produced 785 TWh of electricity in the United States, 485 TWh in China, 392 TWh in France, 219 TWh in Russia and 185 TWh in South Korea. The United States' nuclear electricity production has been the largest of the five every year since 1990. The most recent change in their order came in 2020, when China's nuclear electricity production passed France's.
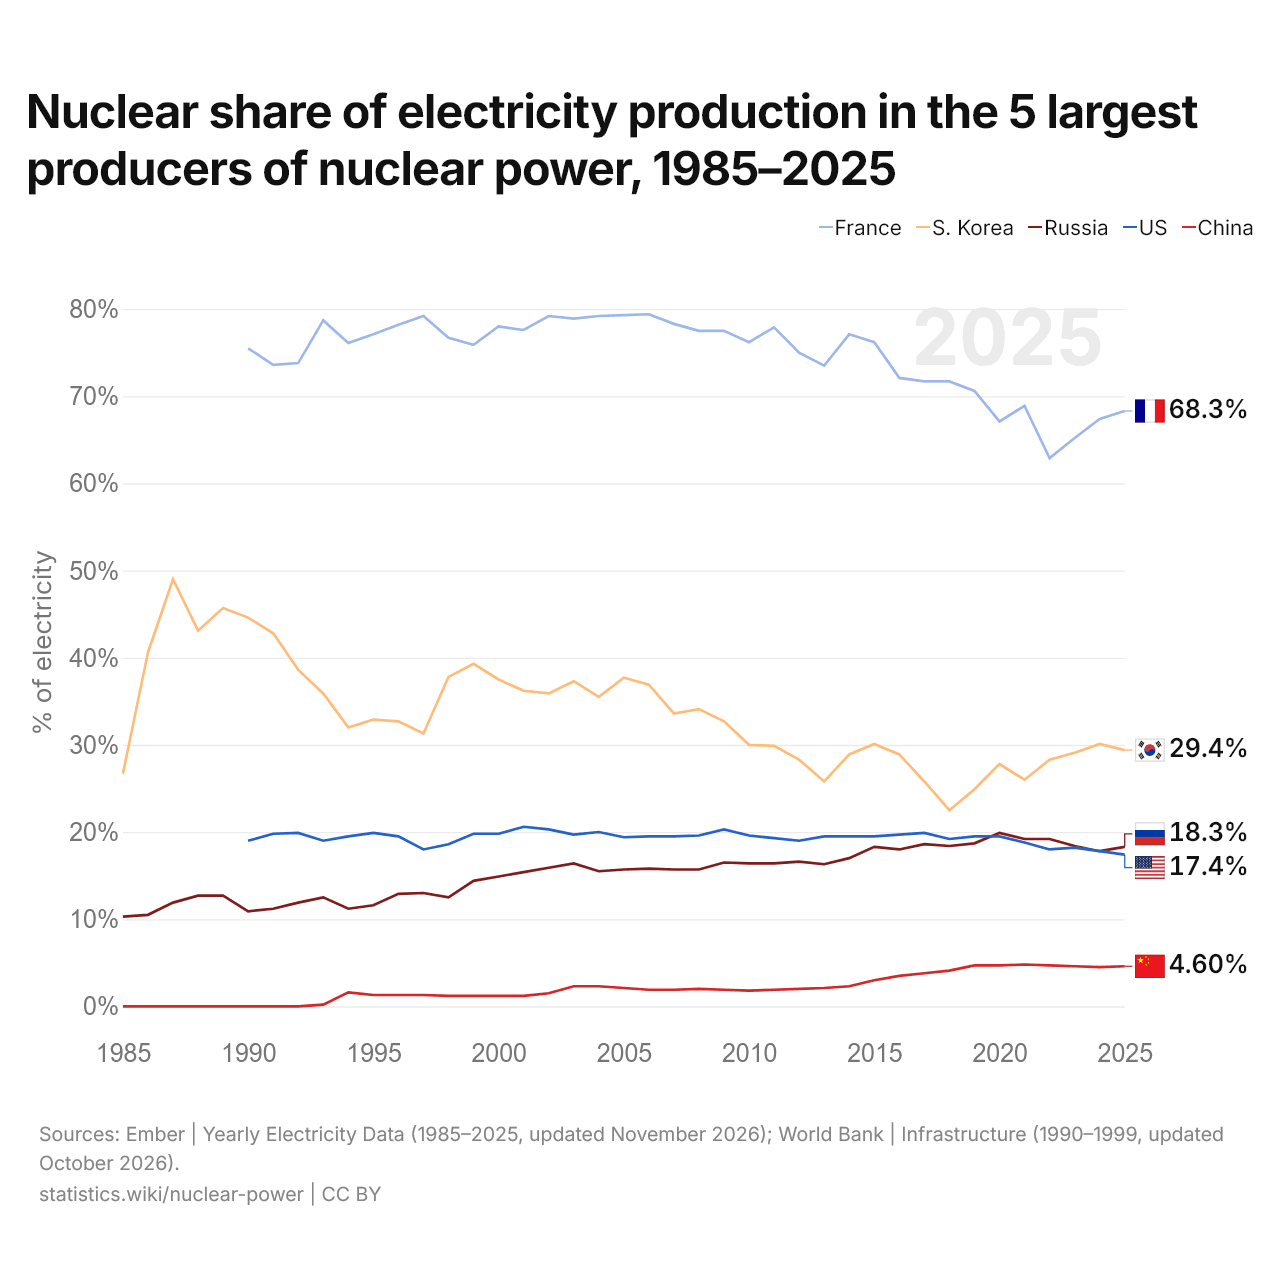
Nuclear share of electricity production in the 5 largest producers of nuclear power, 1985–2025
| Year | % of electricity | ||||
|---|---|---|---|---|---|
| France | South Korea | Russia | United States | China | |
| 2025 | 68.3% | 29.4% | 18.3% | 17.4% | 4.6% |
| 2024 | 67.4% | 30.1% | 17.8% | 17.8% | 4.5% |
| 2023 | 65.2% | 29.1% | 18.4% | 18.2% | 4.6% |
| 2022 | 62.9% | 28.3% | 19.2% | 18% | 4.7% |
| 2021 | 68.9% | 26% | 19.2% | 18.8% | 4.8% |
| 2020 | 67.1% | 27.8% | 19.9% | 19.5% | 4.7% |
| 2019 | 70.6% | 24.9% | 18.7% | 19.5% | 4.7% |
| 2018 | 71.7% | 22.5% | 18.4% | 19.2% | 4.1% |
| 2017 | 71.7% | 25.8% | 18.6% | 19.9% | 3.8% |
| 2016 | 72.1% | 28.9% | 18% | 19.7% | 3.5% |
| 2015 | 76.2% | 30.1% | 18.3% | 19.5% | 3% |
| 2014 | 77.1% | 28.9% | 17% | 19.5% | 2.3% |
| 2013 | 73.5% | 25.8% | 16.3% | 19.5% | 2.1% |
| 2012 | 75% | 28.3% | 16.6% | 19% | 2% |
| 2011 | 77.9% | 29.9% | 16.4% | 19.3% | 1.9% |
| 2010 | 76.2% | 30% | 16.4% | 19.6% | 1.8% |
| 2009 | 77.5% | 32.7% | 16.5% | 20.3% | 1.9% |
| 2008 | 77.5% | 34.1% | 15.7% | 19.6% | 2% |
| 2007 | 78.3% | 33.6% | 15.7% | 19.5% | 1.9% |
| 2006 | 79.4% | 36.9% | 15.8% | 19.5% | 1.9% |
| 2005 | 79.3% | 37.7% | 15.7% | 19.4% | 2.1% |
| 2004 | 79.2% | 35.5% | 15.5% | 20% | 2.3% |
| 2003 | 78.9% | 37.3% | 16.4% | 19.7% | 2.3% |
| 2002 | 79.2% | 35.9% | 15.9% | 20.3% | 1.5% |
| 2001 | 77.6% | 36.2% | 15.4% | 20.6% | 1.2% |
| 2000 | 78% | 37.5% | 14.9% | 19.8% | 1.2% |
| 1999 | 75.9% | 39.3% | 14.4% | 19.8% | 1.2% |
| 1998 | 76.7% | 37.8% | 12.5% | 18.6% | 1.2% |
| 1997 | 79.2% | 31.3% | 13% | 18% | 1.3% |
| 1996 | 78.2% | 32.7% | 12.9% | 19.5% | 1.3% |
| 1995 | 77.1% | 32.9% | 11.6% | 19.9% | 1.3% |
| 1994 | 76.1% | 32% | 11.2% | 19.5% | 1.6% |
| 1993 | 78.7% | 35.9% | 12.5% | 19% | 0.2% |
| 1992 | 73.8% | 38.6% | 11.9% | 19.9% | 0% |
| 1991 | 73.6% | 42.8% | 11.2% | 19.8% | 0% |
| 1990 | 75.5% | 44.6% | 10.9% | 19% | 0% |
| 1989 | - | 45.7% | 12.7% | - | 0% |
| 1988 | - | 43.1% | 12.7% | - | 0% |
| 1987 | - | 49% | 11.9% | - | 0% |
| 1986 | - | 40.6% | 10.5% | - | 0% |
| 1985 | - | 26.7% | 10.3% | - | 0% |
In 2025, nuclear power produced 68.3% of the electricity in France, 29.4% in South Korea, 18.3% in Russia, 17.4% in the United States and 4.6% in China. France's share has been the highest of the five every year since 1990. The most recent change in their order came in 2020, when Russia's share passed the United States'.
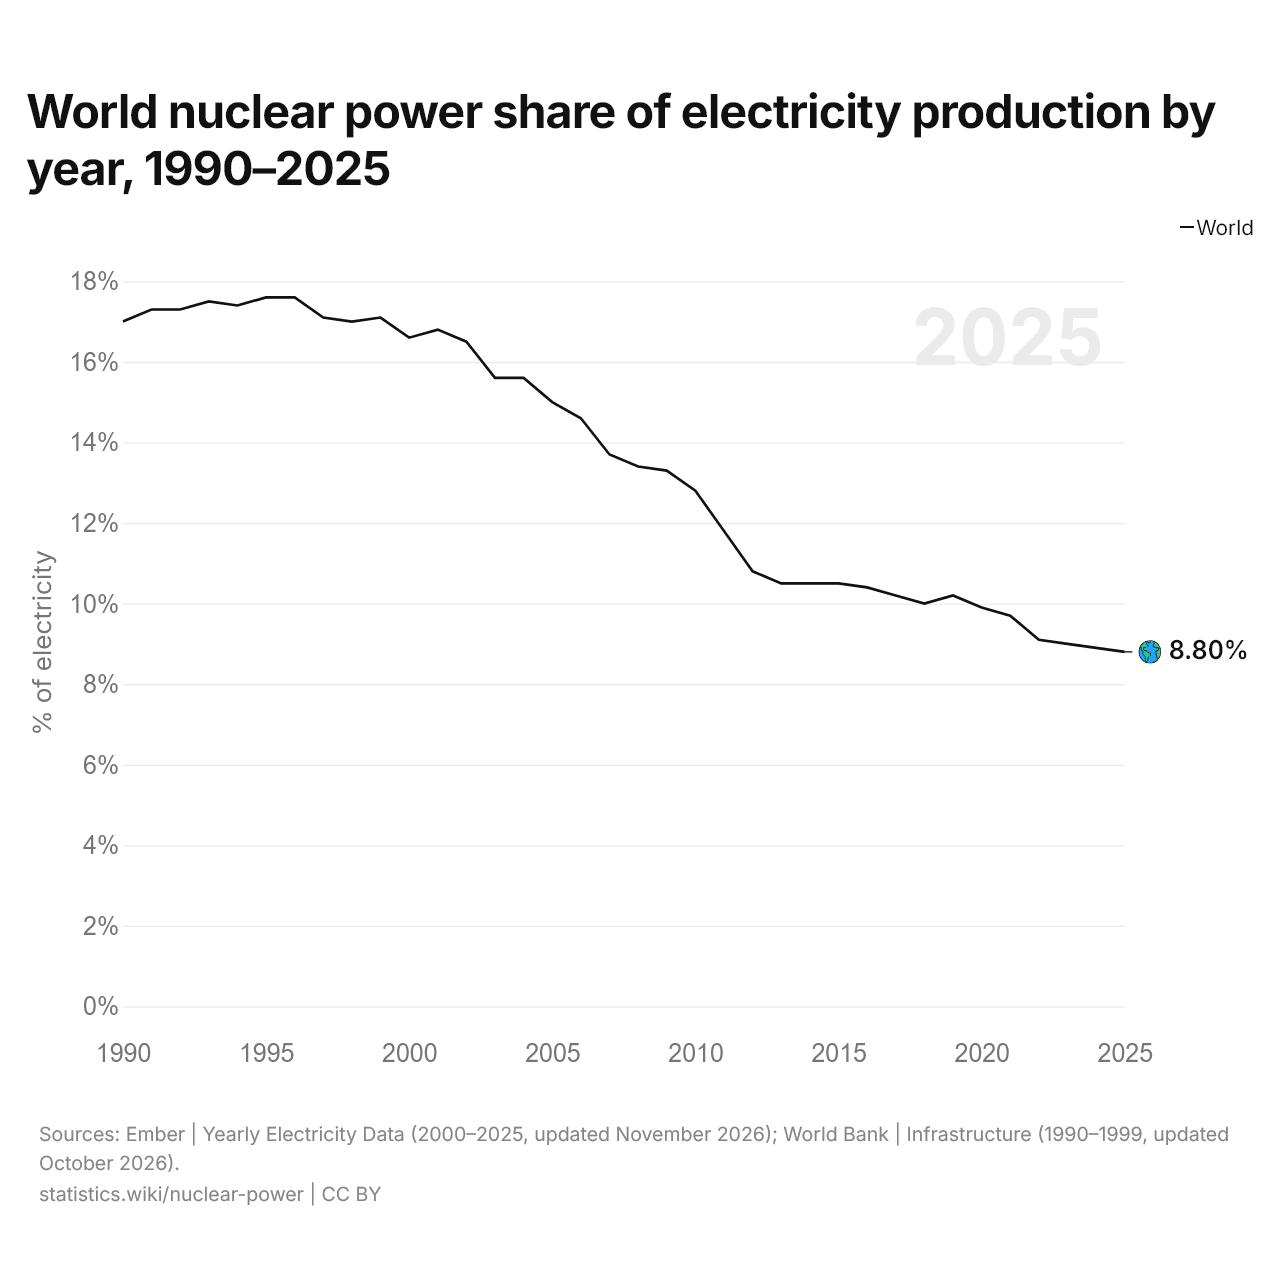
World nuclear power share of electricity production by year, 1990–2025
| Year | % of electricity |
|---|---|
| World | |
| 2025 | 8.8% |
| 2024 | 8.9% |
| 2023 | 9% |
| 2022 | 9.1% |
| 2021 | 9.7% |
| 2020 | 9.9% |
| 2019 | 10.2% |
| 2018 | 10% |
| 2017 | 10.2% |
| 2016 | 10.4% |
| 2015 | 10.5% |
| 2014 | 10.5% |
| 2013 | 10.5% |
| 2012 | 10.8% |
| 2011 | 11.8% |
| 2010 | 12.8% |
| 2009 | 13.3% |
| 2008 | 13.4% |
| 2007 | 13.7% |
| 2006 | 14.6% |
| 2005 | 15% |
| 2004 | 15.6% |
| 2003 | 15.6% |
| 2002 | 16.5% |
| 2001 | 16.8% |
| 2000 | 16.6% |
| 1999 | 17.1% |
| 1998 | 17% |
| 1997 | 17.1% |
| 1996 | 17.6% |
| 1995 | 17.6% |
| 1994 | 17.4% |
| 1993 | 17.5% |
| 1992 | 17.3% |
| 1991 | 17.3% |
| 1990 | 17% |
Nuclear power produced 8.8% of the world's electricity in 2025, down from 17.0% in 1990. The share was highest in 1996, at 17.6%.
10 largest producers of nuclear electricity, TWh (2025)
10 smallest producers of nuclear electricity, TWh (2025)
After the five largest producers come Japan (94.1 TWh), Canada (84.8 TWh), Ukraine (62.2 TWh, 2022), Spain (54.1 TWh) and India (53.8 TWh). The ten largest producers generated 86% of the world's nuclear electricity.
The 10 largest producers of nuclear electricity each year, 1993–2025
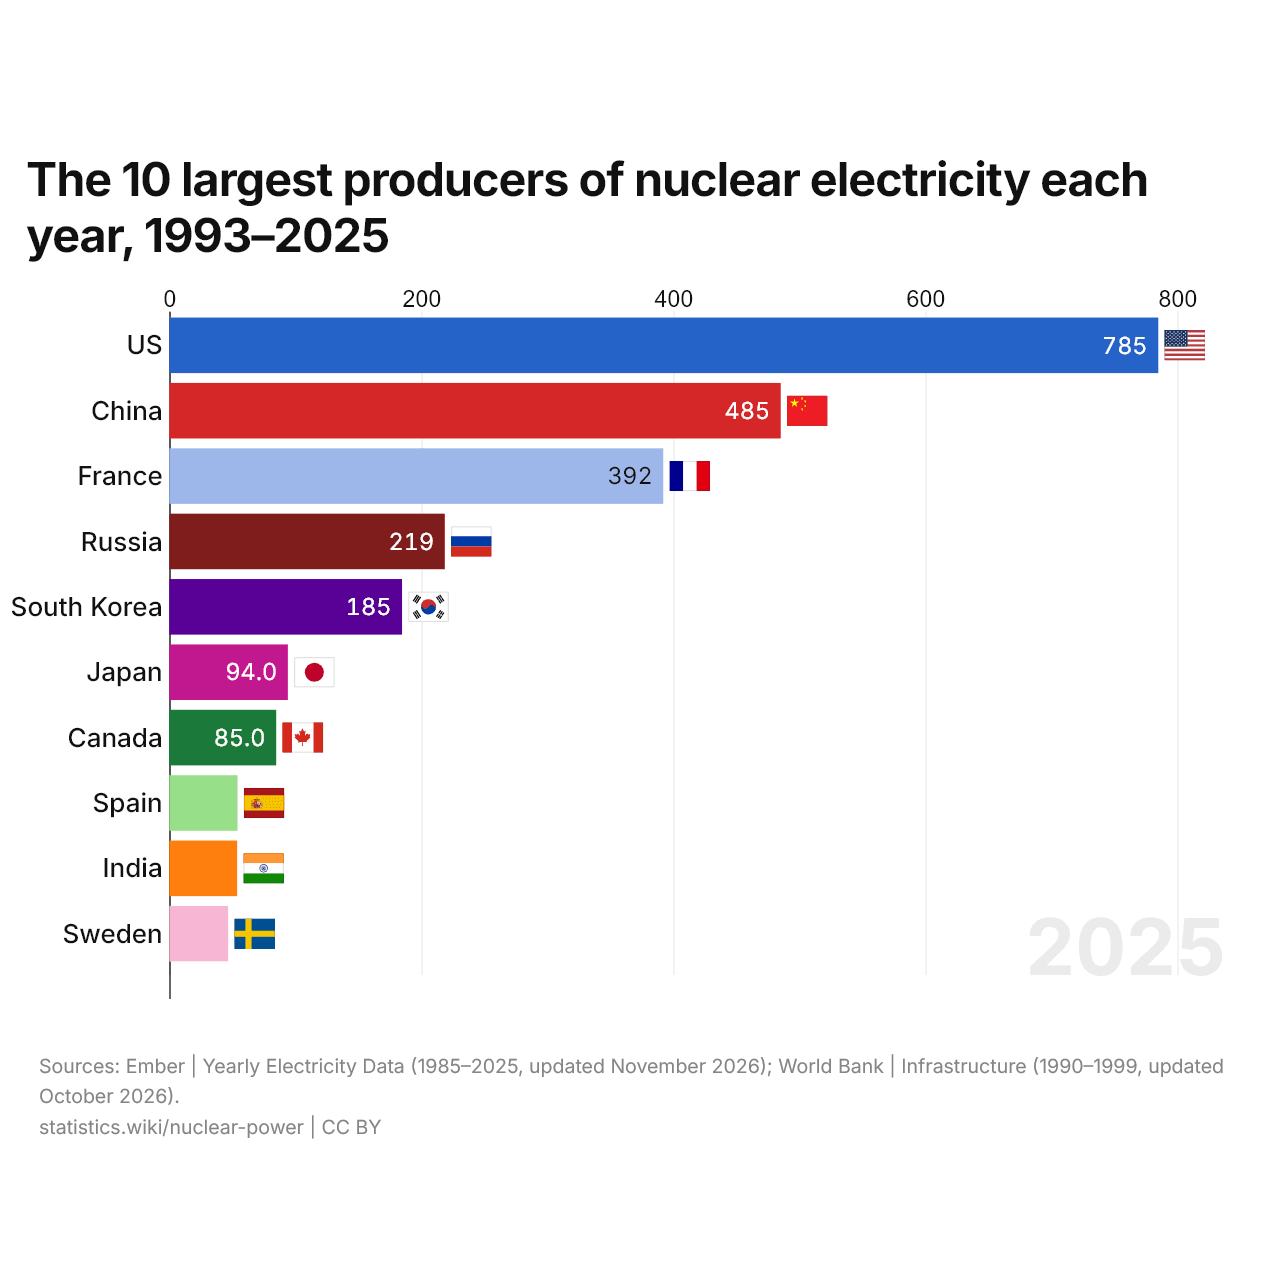
The ten largest producers of nuclear electricity generated 86% of the world's nuclear electricity in 2025, compared with 87% in 1993. China moved up the most among the ten of 2025, from 25th in 1993 to 2nd.
Compare the nuclear power of any 2 countries
Sources:
- Ember | Yearly Electricity Data (1985–2025, updated November 2026)
- World Bank | Infrastructure (1990–2024, updated October 2026)
Creative Commons Attribution (CC BY): you may copy, share, adapt and reuse this content, also commercially, as long as you credit statistics.wiki and note any changes you made. The sources listed above may have their own license terms.