
List of countries by electricity consumption per capita, with total TWh
| Rank | Country | kWh per person | TWh |
|---|---|---|---|
 World |
3,708 | 30,135 | |
| 1 |  Iceland |
47,510 (2025) | 18.6 (2025) |
| 2 |  Bahrain |
23,846 | 37.9 |
| 3 |  Norway |
23,699 (2025) | 133 (2025) |
| 4 |  Qatar |
19,313 | 55.2 |
| 5 |  Kuwait |
16,626 | 81.4 |
| 6 |  UAE |
15,361 | 169 |
| 7 |  Finland |
15,057 (2025) | 85 (2025) |
| 8 |  Canada |
14,655 (2025) | 610 (2025) |
| 9 |  United States |
13,064 (2025) | 4,465 (2025) |
| 10 |  South Korea |
12,071 (2025) | 624 (2025) |
| 11 |  Sweden |
11,974 (2025) | 127 (2025) |
| 12 |  Saudi Arabia |
11,808 | 417 |
| 13 |  Brunei |
10,963 | 5.07 |
| 14 |  Luxembourg |
10,209 (2025) | 7.01 (2025) |
| 15 |  Singapore |
9,947 | 60 |
| 16 |  Australia |
9,795 (2025) | 270 (2025) |
| 17 |  Oman |
8,489 | 44.8 |
| 18 |  Austria |
8,050 (2025) | 74.1 (2025) |
| 19 |  New Zealand |
7,910 (2025) | 42.1 (2025) |
| 20 |  Russia |
7,774 | 1,117 |
| 21 |  Japan |
7,531 (2025) | 929 (2025) |
| 22 |  Israel |
7,203 (2025) | 72.9 (2025) |
| 23 |  Switzerland |
7,111 (2025) | 64.7 (2025) |
| 24 |  China |
7,038 | 9,916 |
| 25 |  Belgium |
6,963 (2025) | 83.2 (2025) |
| 26 |  Trinidad |
6,816 | 9.33 |
| 27 |  France |
6,536 (2025) | 449 (2025) |
| 28 |  Ireland |
6,497 (2025) | 35.6 (2025) |
| 29 |  Netherlands |
6,447 (2025) | 117 (2025) |
| 30 |  Slovenia |
6,417 (2025) | 13.7 (2025) |
| 31 |  Denmark |
6,373 (2025) | 38.3 (2025) |
| 32 |  Estonia |
6,161 (2025) | 8.42 (2025) |
| 33 |  Germany |
6,060 (2025) | 506 (2025) |
| 34 |  Czech Republic |
6,042 (2025) | 65.8 (2025) |
| 35 |  Kazakhstan |
5,667 | 117 |
| 36 |  Curacao |
5,610 | 0.88 |
| 37 |  Bulgaria |
5,470 | 35.2 |
| 38 |  Portugal |
5,460 (2025) | 59 (2025) |
| 39 |  Malaysia |
5,418 | 193 |
| 40 |  Spain |
5,337 (2025) | 263 (2025) |
| 41 |  Italy |
5,178 (2025) | 305 (2025) |
| 42 |  Serbia |
5,166 | 34 |
| 43 |  Libya |
5,156 | 38.1 |
| 44 |  Malta |
5,138 | 2.92 |
| 45 |  Hungary |
4,825 (2025) | 45.9 (2025) |
| 46 |  Greece |
4,782 (2025) | 49.8 (2025) |
| 47 |  Slovakia |
4,713 (2025) | 25.5 (2025) |
| 48 |  Montenegro |
4,691 | 2.93 |
| 49 |  Croatia |
4,630 | 17.9 |
| 50 |  Poland |
4,565 (2025) | 166 (2025) |
| 51 |  Belarus |
4,415 | 40.3 |
| 52 |  Lithuania |
4,397 (2025) | 12.7 (2025) |
| 53 |  Chile |
4,348 (2025) | 86.3 (2025) |
| 54 |  United Kingdom |
4,208 (2025) | 292 (2025) |
| 55 |  Cyprus |
4,071 | 5.53 |
| 56 |  Latvia |
4,038 (2025) | 7.46 (2025) |
| 57 |  Uruguay |
4,013 | 13.6 |
| 58 |  Iran |
3,910 | 358 |
| 59 |  Turkey |
3,873 (2025) | 333 (2025) |
| 60 |  Bosnia |
3,860 | 12.2 |
| 61 |  Georgia |
3,486 | 13.3 |
| 62 |  Turkmenistan |
3,397 | 25.5 |
| 63 |  South Africa |
3,308 | 212 |
| 64 |  North Macedonia |
3,301 | 6.02 |
| 65 |  Brazil |
3,138 (2025) | 668 (2025) |
| 66 |  Thailand |
3,080 | 221 |
| 67 |  Albania |
2,986 | 7.1 |
| 68 |  Mongolia |
2,969 | 10.5 |
| 69 |  Suriname |
2,919 | 1.85 |
| 70 |  Paraguay |
2,849 | 19.7 |
| 71 |  Argentina |
2,835 (2025) | 130 (2025) |
| 72 |  Vietnam |
2,756 | 278 |
| 73 |  Romania |
2,682 | 51.1 |
| 74 |  Ukraine |
2,599 | 98.4 |
| 75 |  Mexico |
2,595 (2025) | 342 (2025) |
| 76 |  Mauritius |
2,588 | 3.22 |
| 77 |  Moldova |
2,550 | 6.13 |
| 78 |  Armenia |
2,478 | 7.52 |
| 79 |  Azerbaijan |
2,444 | 24.9 |
| 80 |  Costa Rica |
2,382 (2025) | 12.3 (2025) |
| 81 |  Venezuela |
2,362 | 67.1 |
| 82 |  Panama |
2,242 | 10.1 |
| 83 |  Kyrgyzstan |
2,168 | 15.7 |
| 84 |  Uzbekistan |
2,097 | 76.2 |
| 85 |  Dominican Republic |
2,034 | 23.2 |
| 86 |  Jordan |
1,962 | 22.7 |
| 87 |  Algeria |
1,918 | 89.8 |
| 88 |  Iraq |
1,756 | 80.8 |
| 89 |  Botswana |
1,660 | 4.19 |
| 90 |  Ecuador |
1,639 | 29.7 |
| 91 |  Peru |
1,637 | 56 |
| 92 |  Colombia |
1,636 (2025) | 87.4 (2025) |
| 93 |  Indonesia |
1,611 | 457 |
| 94 |  Tunisia |
1,570 | 19.3 |
| 95 |  Tajikistan |
1,559 | 16.5 |
| 96 |  Egypt |
1,555 | 181 |
| 97 |  Laos |
1,502 | 11.7 |
| 98 |  Cuba |
1,373 | 15.1 |
| 99 |  Namibia |
1,246 | 3.78 |
| 100 |  India |
1,223 | 1,774 |
| 101 |  El Salvador |
1,208 | 7.66 |
| 102 |  Jamaica |
1,202 | 3.41 |
| 103 |  Eswatini |
1,102 | 1.37 |
| 104 |  Cambodia |
1,086 | 19.2 |
| 105 |  Morocco |
1,035 | 39.4 |
| 106 |  Gabon |
1,016 | 2.58 |
| 107 |  Philippines |
988 | 114 |
| 108 |  Bolivia |
911 | 11.3 |
| 109 |  Equatorial Guinea |
855 | 1.62 |
| 110 |  Lebanon |
848 | 4.92 |
| 111 |  Honduras |
816 | 8.84 |
| 112 |  North Korea |
794 | 21 |
| 113 |  Guatemala |
743 | 13.7 |
| 114 |  Sri Lanka |
695 | 15.2 |
| 115 |  Syria |
660 | 16.3 |
| 116 |  Nicaragua |
647 | 4.47 |
| 117 |  Bangladesh |
632 | 110 |
| 118 |  Ghana |
598 | 20.6 |
| 119 |  Zimbabwe |
553 | 9.19 |
| 120 |  Zambia |
514 | 11 |
| 121 |  Pakistan |
493 | 124 |
| 122 |  Senegal |
419 | 7.76 |
| 123 |  Mozambique |
390 | 13.5 |
| 124 |  Nepal |
389 | 11.5 |
| 125 |  Ivory Coast |
366 | 11.7 |
| 126 |  Angola |
353 | 13.4 |
| 127 |  Myanmar |
296 | 16.1 |
| 128 |  Congo |
271 | 1.72 |
| 129 |  Togo |
242 | 2.04 |
| 130 |  Cameroon |
202 | 5.89 |
| 131 |  Kenya |
195 | 11 |
| 132 |  Sudan |
192 | 9.67 |
| 133 |  Tanzania |
171 | 11.8 |
| 134 |  Ethiopia |
157 | 20.8 |
| 135 |  Burkina Faso |
145 | 3.43 |
| 136 |  Nigeria |
141 | 32.7 |
| 137 |  Eritrea |
128 | 0.45 |
| 138 |  DR Congo |
127 | 13.9 |
| 139 |  Benin |
123 | 1.77 |
| 140 |  Yemen |
99 | 4.02 |
| 141 |  Uganda |
99 | 4.93 |
| 142 |  Rwanda |
79 | 1.13 |
| 143 |  Madagascar |
77 | 2.45 |
| 144 |  Niger |
64 | 1.74 |
| 145 |  Haiti |
63 | 0.75 |
| 146 |  South Sudan |
53 | 0.64 |
| 147 |  Chad |
13 | 0.26 |
The list ranks 147 countries by their latest electricity consumption per capita, from Iceland (47,510 kWh per person) to Chad (13 kWh). The world consumes 3,708 kWh of electricity per person. Half of the countries consume less than 2,599 kWh per person.
Electricity consumption per capita is the electricity a country's power plants produce, minus what is lost on the way to the consumers and what the plants use themselves, divided by its population. It covers homes, businesses, industry and transport, so it measures a country's use of electricity as a whole, not what a household uses.
Electricity consumption per capita by country map
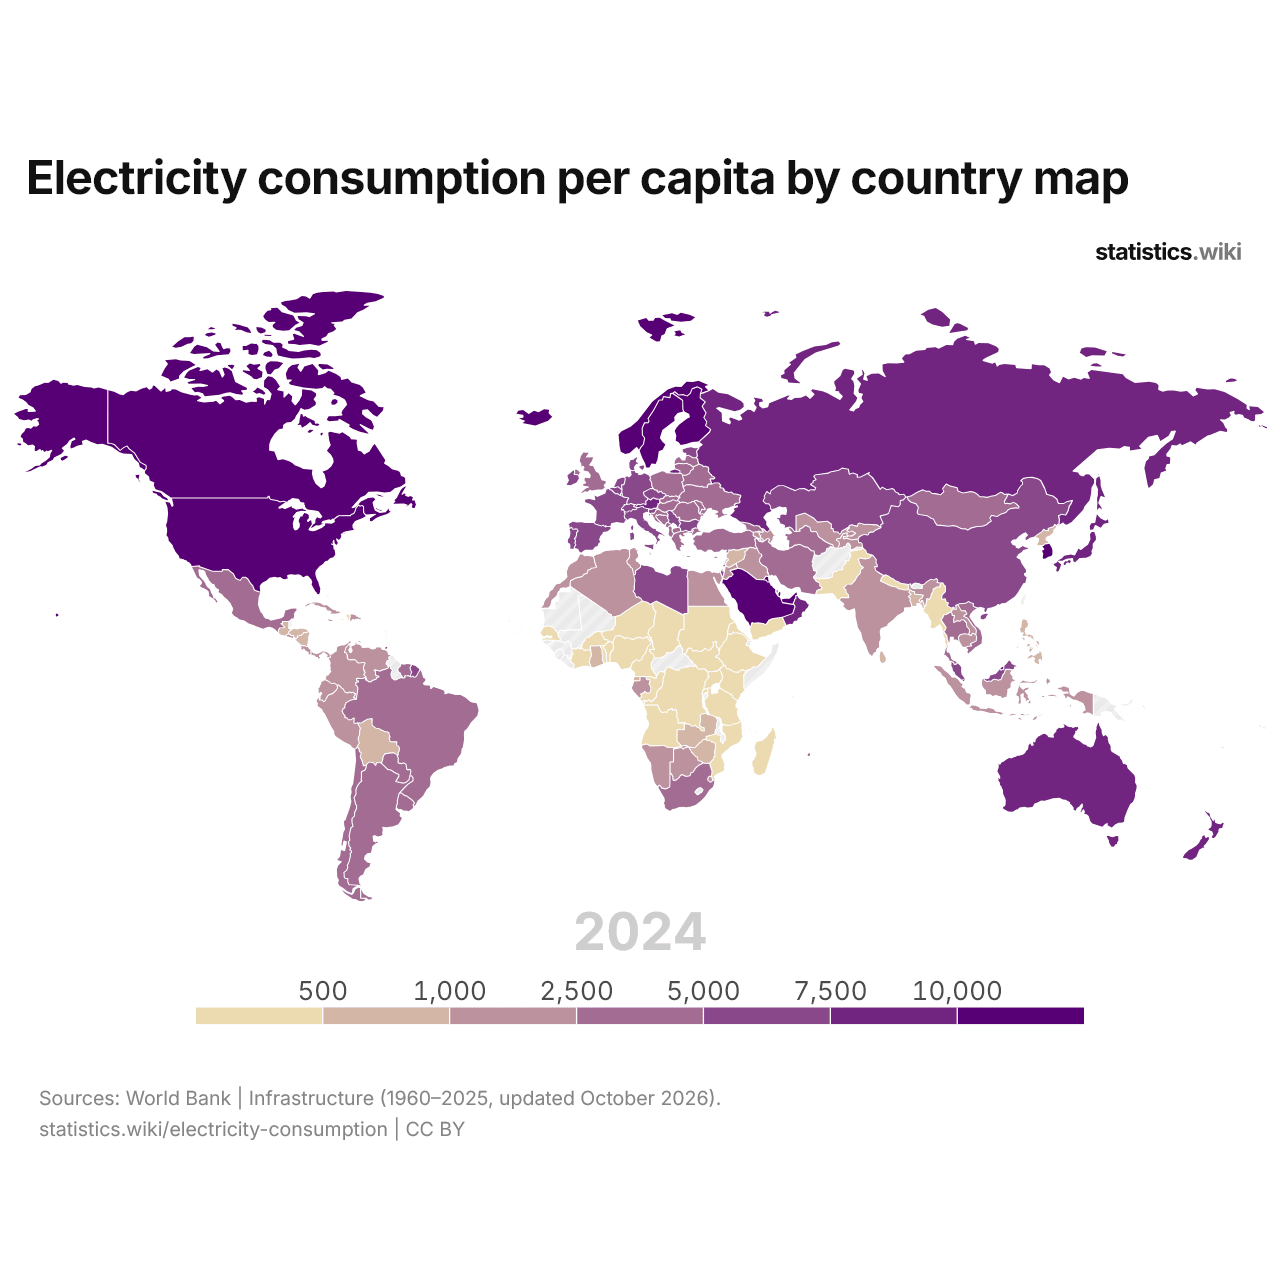
Electricity consumption is above 10,000 kWh per person in 14 countries and below 500 kWh in 27; in 1990, the numbers were 10 and 48.
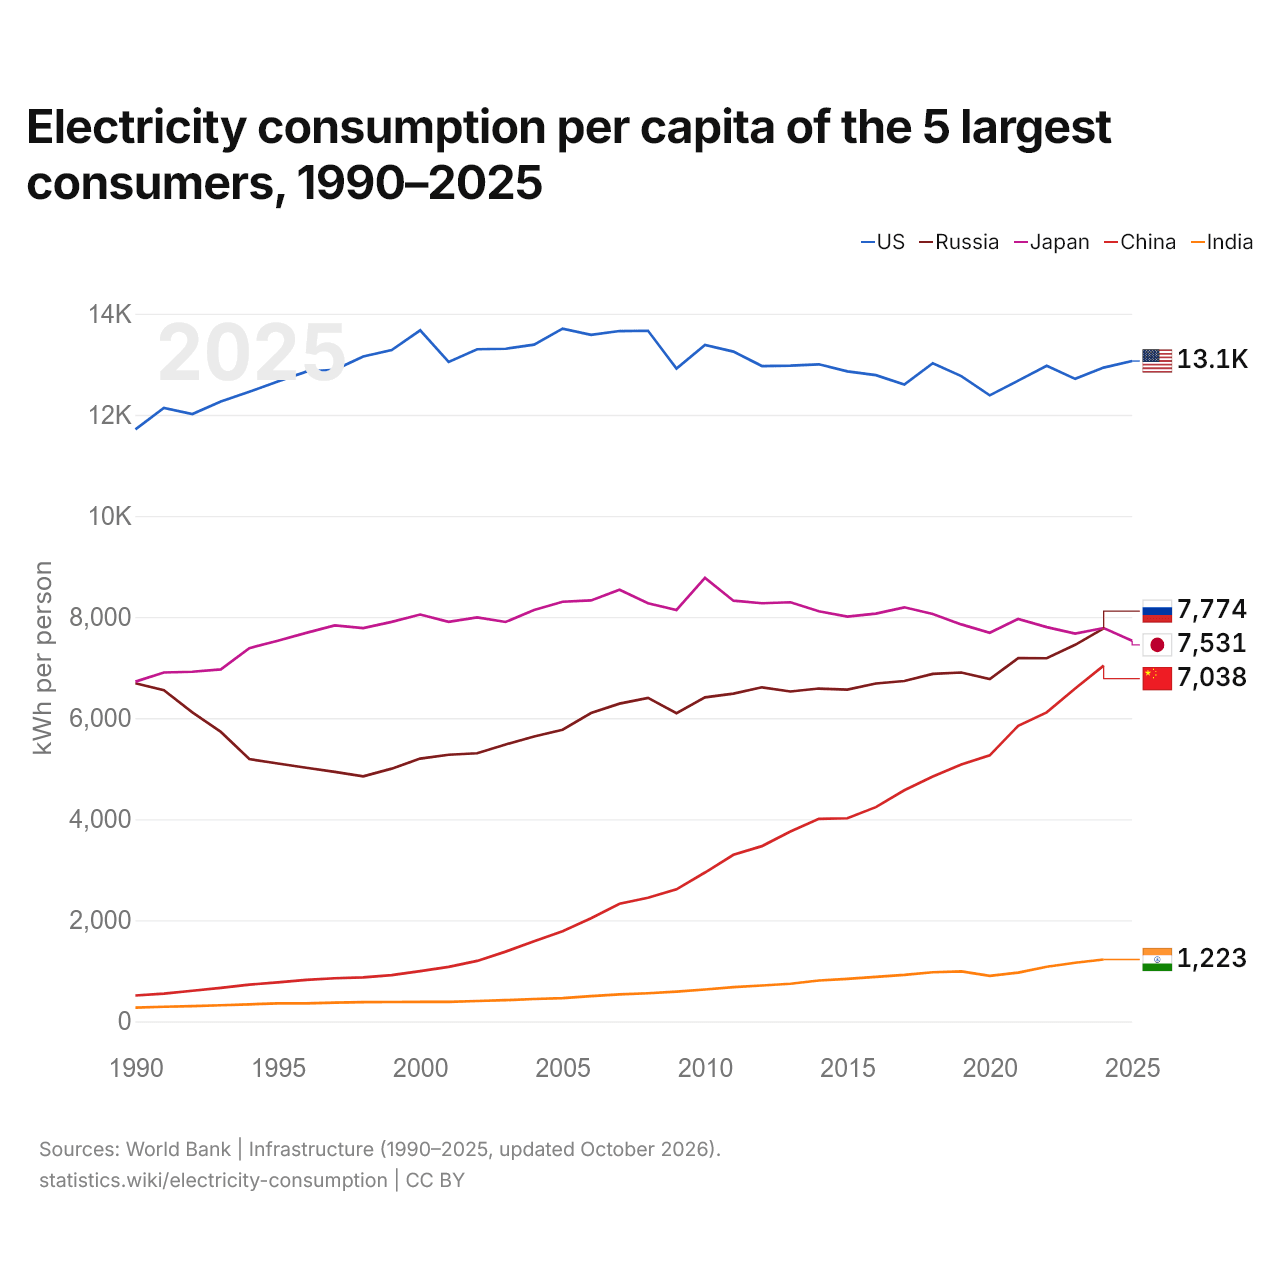
Electricity consumption per capita of the 5 largest consumers, 1990–2025
| Year | kWh per person | ||||
|---|---|---|---|---|---|
| United States | Russia | Japan | China | India | |
| 2025 | 13,064 | - | 7,531 | - | - |
| 2024 | 12,934 | 7,774 | 7,781 | 7,038 | 1,223 |
| 2023 | 12,711 | 7,449 | 7,672 | 6,586 | 1,160 |
| 2022 | 12,969 | 7,184 | 7,800 | 6,112 | 1,081 |
| 2021 | 12,676 | 7,187 | 7,961 | 5,848 | 964 |
| 2020 | 12,385 | 6,770 | 7,687 | 5,262 | 901 |
| 2019 | 12,766 | 6,902 | 7,853 | 5,082 | 988 |
| 2018 | 13,020 | 6,873 | 8,058 | 4,842 | 971 |
| 2017 | 12,600 | 6,734 | 8,191 | 4,571 | 918 |
| 2016 | 12,785 | 6,684 | 8,066 | 4,238 | 880 |
| 2015 | 12,860 | 6,563 | 8,007 | 4,017 | 841 |
| 2014 | 12,999 | 6,584 | 8,113 | 4,006 | 808 |
| 2013 | 12,972 | 6,526 | 8,291 | 3,757 | 743 |
| 2012 | 12,964 | 6,609 | 8,271 | 3,466 | 709 |
| 2011 | 13,250 | 6,483 | 8,322 | 3,296 | 678 |
| 2010 | 13,382 | 6,410 | 8,774 | 2,944 | 629 |
| 2009 | 12,914 | 6,095 | 8,139 | 2,612 | 588 |
| 2008 | 13,663 | 6,400 | 8,270 | 2,446 | 555 |
| 2007 | 13,657 | 6,286 | 8,540 | 2,326 | 533 |
| 2006 | 13,583 | 6,099 | 8,327 | 2,039 | 500 |
| 2005 | 13,705 | 5,770 | 8,301 | 1,782 | 459 |
| 2004 | 13,389 | 5,634 | 8,137 | 1,586 | 442 |
| 2003 | 13,307 | 5,478 | 7,901 | 1,379 | 419 |
| 2002 | 13,296 | 5,304 | 7,991 | 1,195 | 402 |
| 2001 | 13,047 | 5,274 | 7,903 | 1,077 | 385 |
| 2000 | 13,671 | 5,198 | 8,048 | 993 | 385 |
| 1999 | 13,282 | 4,999 | 7,903 | 914 | 383 |
| 1998 | 13,155 | 4,848 | 7,779 | 871 | 380 |
| 1997 | 12,890 | 4,936 | 7,832 | 853 | 369 |
| 1996 | 12,854 | 5,016 | 7,686 | 821 | 354 |
| 1995 | 12,660 | 5,102 | 7,531 | 770 | 354 |
| 1994 | 12,455 | 5,188 | 7,384 | 727 | 337 |
| 1993 | 12,262 | 5,726 | 6,962 | 663 | 318 |
| 1992 | 12,015 | 6,114 | 6,917 | 605 | 302 |
| 1991 | 12,134 | 6,551 | 6,902 | 549 | 289.3 |
| 1990 | 11,713 | 6,688 | 6,721 | 511 | 270.9 |
Electricity consumption per person is 13,064 kWh in the United States (2025), 7,774 kWh in Russia, 7,531 kWh in Japan (2025), 7,038 kWh in China and 1,223 kWh in India. The United States' consumption per person has been the highest of the five every year since 1990.
Compare the electricity consumption of any 2 countries
Sources:
- World Bank | Infrastructure (1960–2025, updated October 2026)
- U.S. Census Bureau (2024–2025, updated October 2026)
- Central Intelligence Agency (CIA) (2024, updated October 2026)
- National Statistics, Taiwan (2024, updated October 2026)
Creative Commons Attribution (CC BY): you may copy, share, adapt and reuse this content, also commercially, as long as you credit statistics.wiki and note any changes you made. The sources listed above may have their own license terms.