
List of countries by CO2 emissions per capita
| Rank | Country | CO2 emissions per capita, tonnes | × world average | Change since 1990 |
|---|---|---|---|---|
 World |
4.87 | +13.8% | ||
| 1 |  Qatar |
47.3 | 9.72× | +22.7% |
| 2 |  Bahrain |
23.9 | 4.91× | +2.6% |
| 3 |  Kuwait |
23.7 | 4.86× | +23.1% |
| 4 |  Brunei |
20.2 | 4.16× | +20.2% |
| 5 |  Trinidad |
19.6 | 4.02× | +93.5% |
| 6 |  Oman |
18.7 | 3.83× | +100% |
| 7 |  Saudi Arabia |
18.5 | 3.8× | +13.1% |
| 8 |  UAE |
18.3 | 3.75× | −39.1% |
| 9 |  Australia |
14.1 | 2.9× | −13.4% |
| 10 |  Canada |
14 | 2.88× | −11.9% |
| 11 |  Russia |
14 | 2.87× | −15.1% |
| 12 |  United States |
13.6 | 2.8× | −32.0% |
| 13 |  Kazakhstan |
12.6 | 2.58× | −13.3% |
| 14 |  Taiwan |
11.4 (2023) | 2.36× | n/a |
| 15 |  South Korea |
11.4 | 2.33× | +87.2% |
| 16 |  Turkmenistan |
10.9 | 2.23× | −10.6% |
| 17 |  Luxembourg |
10.6 | 2.17× | −66.3% |
| 18 |  Singapore |
9.75 | 2× | −6.1% |
| 19 |  China |
9.32 | 1.91× | +338% |
| 20 |  Iran |
9.05 | 1.86× | +154% |
| 21 |  Libya |
8.66 | 1.78× | +18.1% |
| 22 |  Iceland |
8.52 | 1.75× | −7.2% |
| 23 |  Malaysia |
8.32 | 1.71× | +130% |
| 24 |  Mongolia |
7.85 | 1.61× | +25.3% |
| 25 |  Japan |
7.84 | 1.61× | −16.7% |
| 26 |  Estonia |
7.76 | 1.59× | −69.6% |
| 27 |  Poland |
7.55 | 1.55× | −22.5% |
| 28 |  Belgium |
7.31 | 1.5× | −37.1% |
| 29 |  Seychelles |
7.24 | 1.49× | +89.2% |
| 30 |  Norway |
7.18 | 1.47× | −16.2% |
| 31 |  Czech Republic |
7.13 | 1.46× | −55.5% |
| 32 |  Germany |
6.94 | 1.43× | −45.5% |
| 33 |  South Africa |
6.88 | 1.41× | −10.8% |
| 34 |  Netherlands |
6.6 | 1.36× | −40.1% |
| 35 |  Bosnia |
6.45 | 1.32× | +16.8% |
| 36 |  Austria |
6.32 | 1.3× | −21.1% |
| 37 |  Slovenia |
6.27 | 1.29× | −14.7% |
| 38 |  Ireland |
6.04 | 1.24× | −34.4% |
| 39 |  New Zealand |
6.01 | 1.24× | −19.8% |
| 40 |  Belarus |
5.94 | 1.22× | −42.7% |
| 41 |  Israel |
5.77 | 1.18× | −23.7% |
| 42 |  Finland |
5.54 | 1.14× | −50.9% |
| 43 |  Slovakia |
5.51 | 1.13× | −51.8% |
| 44 |  Cyprus |
5.4 | 1.11× | −8.2% |
| 45 |  Turkey |
5.38 | 1.1× | +94.2% |
| 46 |  Bulgaria |
5.31 | 1.09× | −42.2% |
| 47 |  Iraq |
5.18 | 1.06× | +31.2% |
| 48 |  Italy |
5.08 | 1.04× | −32.4% |
| 49 |  Greece |
5.05 | 1.04× | −34.0% |
| 50 |  Cayman Islands |
5 | 1.03× | +12.3% |
| 51 |  Croatia |
4.83 | 0.99× | −3.9% |
| 52 |  Guyana |
4.56 | 0.94× | +191% |
| 53 |  Spain |
4.51 | 0.93× | −23.7% |
| 54 |  Lithuania |
4.49 | 0.92× | −52.7% |
| 55 |  Hungary |
4.46 | 0.92× | −36.1% |
| 56 |  Denmark |
4.28 | 0.88× | −58.1% |
| 57 |  Vietnam |
4.27 | 0.88× | +1,258% |
| 58 |  United Kingdom |
4.22 | 0.87× | −58.5% |
| 59 |  Uzbekistan |
4.09 | 0.84× | −34.6% |
| 60 |  Suriname |
4.06 | 0.83× | +52.6% |
| 61 |  Argentina |
4.01 | 0.82× | +31.1% |
| 62 |  France |
4 | 0.82× | −39.4% |
| 63 |  North Macedonia |
4 | 0.82× | −26.2% |
| 64 |  Algeria |
3.98 | 0.82× | +40.0% |
| 65 |  Thailand |
3.96 | 0.81× | +127% |
| 66 |  Chile |
3.94 | 0.81× | +59.3% |
| 67 |  Azerbaijan |
3.81 | 0.78× | −51.3% |
| 68 |  Antigua |
3.8 | 0.78× | +46.1% |
| 69 |  Switzerland |
3.75 | 0.77× | −43.8% |
| 70 |  Romania |
3.72 | 0.76× | −54.0% |
| 71 |  Latvia |
3.65 | 0.75× | −50.5% |
| 72 |  Mexico |
3.64 | 0.75× | +4.0% |
| 73 |  Bahamas |
3.64 | 0.75× | −7.6% |
| 74 |  Sweden |
3.57 | 0.73× | −46.5% |
| 75 |  Maldives |
3.57 | 0.73× | +747% |
| 76 |  Mauritius |
3.54 | 0.73× | +215% |
| 77 |  Georgia |
3.53 | 0.73× | −50.8% |
| 78 |  Moldova |
3.42 | 0.7× | −68.0% |
| 79 |  Venezuela |
3.39 | 0.7× | −34.4% |
| 80 |  Laos |
3.35 | 0.69× | +5,552% |
| 81 |  Portugal |
3.32 | 0.68× | −24.3% |
| 82 |  Malta |
3.18 | 0.65× | −51.5% |
| 83 |  Ukraine |
3.13 | 0.64× | −79.3% |
| 84 |  Dominican Republic |
2.99 | 0.62× | +167% |
| 85 |  Saint Kitts |
2.88 | 0.59× | +461% |
| 86 |  Indonesia |
2.87 | 0.59× | +225% |
| 87 |  Jamaica |
2.84 | 0.58× | −12.2% |
| 88 |  Panama |
2.74 | 0.56× | +147% |
| 89 |  Botswana |
2.74 | 0.56× | +26.6% |
| 90 |  Ecuador |
2.64 | 0.54× | +57.8% |
| 91 |  Tunisia |
2.62 | 0.54× | +47.7% |
| 92 |  Uruguay |
2.57 | 0.53× | +102% |
| 93 |  Equatorial Guinea |
2.55 | 0.52× | +1,601% |
| 94 |  Barbados |
2.52 | 0.52× | +6.0% |
| 95 |  Egypt |
2.5 | 0.51× | +59.7% |
| 96 |  North Korea |
2.5 | 0.51× | −60.0% |
| 97 |  Armenia |
2.47 | 0.51× | −57.8% |
| 98 |  Brazil |
2.32 | 0.48× | +52.4% |
| 99 |  Bolivia |
2.29 | 0.47× | +148% |
| 100 |  India |
2.17 | 0.45× | +213% |
| 101 |  Jordan |
2.09 | 0.43× | −24.8% |
| 102 |  Gabon |
2.05 | 0.42× | −67.4% |
| 103 |  Peru |
2.02 | 0.42× | +114% |
| 104 |  Bhutan |
2.01 | 0.41× | +556% |
| 105 |  Cuba |
1.91 | 0.39× | −47.4% |
| 106 |  Lebanon |
1.9 | 0.39× | +14.1% |
| 107 |  Morocco |
1.84 | 0.38× | +99.6% |
| 108 |  Colombia |
1.8 | 0.37× | +9.6% |
| 109 |  Albania |
1.79 | 0.37× | −11.7% |
| 110 |  Saint Lucia |
1.71 | 0.35× | +230% |
| 111 |  Costa Rica |
1.63 | 0.34× | +74.8% |
| 112 |  Tonga |
1.63 | 0.33× | +82.4% |
| 113 |  Fiji |
1.62 | 0.33× | +24.4% |
| 114 |  Samoa |
1.6 | 0.33× | +121% |
| 115 |  El Salvador |
1.51 | 0.31× | +213% |
| 116 |  Philippines |
1.5 | 0.31× | +121% |
| 117 |  Grenada |
1.5 | 0.31× | +195% |
| 118 |  Kyrgyzstan |
1.49 | 0.31× | −72.4% |
| 119 |  Congo |
1.34 | 0.27× | +33.3% |
| 120 |  Saint Vincent |
1.31 | 0.27× | +399% |
| 121 |  Cape Verde |
1.29 | 0.26× | +799% |
| 122 |  Syria |
1.27 | 0.26× | −51.4% |
| 123 |  Dominica |
1.27 | 0.26× | +316% |
| 124 |  Namibia |
1.2 | 0.25× | +32.1% |
| 125 |  Paraguay |
1.16 | 0.24× | +114% |
| 126 |  Honduras |
1.14 | 0.23× | +140% |
| 127 |  Guatemala |
1.11 | 0.23× | +155% |
| 128 |  Cambodia |
1.1 | 0.23× | +1,791% |
| 129 |  Sri Lanka |
1.06 | 0.22× | +311% |
| 130 |  Mauritania |
0.97 | 0.2× | +168% |
| 131 |  Belize |
0.93 | 0.19× | +34.9% |
| 132 |  Tajikistan |
0.92 | 0.19× | −59.6% |
| 133 |  Eswatini |
0.88 | 0.18× | −30.5% |
| 134 |  Vanuatu |
0.87 | 0.18× | +26.4% |
| 135 |  Nicaragua |
0.83 | 0.17× | +75.8% |
| 136 |  Pakistan |
0.81 | 0.17× | +43.7% |
| 137 |  Zimbabwe |
0.77 | 0.16× | −55.0% |
| 138 |  Senegal |
0.77 | 0.16× | +151% |
| 139 |  Djibouti |
0.77 | 0.16× | −54.5% |
| 140 |  Angola |
0.74 | 0.15× | −23.2% |
| 141 |  Bangladesh |
0.72 | 0.15× | +441% |
| 142 |  Ghana |
0.7 | 0.14× | +245% |
| 143 |  Sao Tome |
0.63 | 0.13× | +99.8% |
| 144 |  Kiribati |
0.59 | 0.12× | +166% |
| 145 |  Ivory Coast |
0.59 | 0.12× | +142% |
| 146 |  Myanmar |
0.58 | 0.12× | +417% |
| 147 |  Nigeria |
0.57 | 0.12× | −26.7% |
| 148 |  Zambia |
0.54 | 0.11× | +39.6% |
| 149 |  Nepal |
0.54 | 0.11× | +861% |
| 150 |  Papua New Guinea |
0.52 | 0.11× | −6.3% |
| 151 |  Comoros |
0.51 | 0.11× | +483% |
| 152 |  East Timor |
0.5 | 0.1× | +445% |
| 153 |  Benin |
0.49 | 0.1× | +546% |
| 154 |  Sudan |
0.43 | 0.09× | +72.1% |
| 155 |  Lesotho |
0.43 | 0.09× | +612% |
| 156 |  Solomon Islands |
0.38 | 0.08× | −19.8% |
| 157 |  Kenya |
0.38 | 0.08× | +35.8% |
| 158 |  Cameroon |
0.35 | 0.07× | −15.8% |
| 159 |  Guinea |
0.35 | 0.07× | +140% |
| 160 |  Togo |
0.31 | 0.06× | +53.7% |
| 161 |  Tanzania |
0.31 | 0.06× | +290% |
| 162 |  Mali |
0.3 | 0.06× | +770% |
| 163 |  Haiti |
0.3 | 0.06× | +79.2% |
| 164 |  Mozambique |
0.29 | 0.06× | +229% |
| 165 |  Afghanistan |
0.28 | 0.06× | +17.2% |
| 166 |  Burkina Faso |
0.27 | 0.06× | +670% |
| 167 |  Yemen |
0.26 | 0.05× | −49.1% |
| 168 |  Malawi |
0.22 | 0.05× | +37.5% |
| 169 |  Eritrea |
0.22 | 0.05× | +35.9% |
| 170 |  Gambia |
0.18 | 0.04× | +53.4% |
| 171 |  Sierra Leone |
0.17 | 0.03× | +12.1% |
| 172 |  Uganda |
0.17 | 0.03× | +249% |
| 173 |  Rwanda |
0.16 | 0.03× | +116% |
| 174 |  Guinea-Bissau |
0.16 | 0.03× | −10.4% |
| 175 |  Liberia |
0.15 | 0.03× | −8.4% |
| 176 |  Ethiopia |
0.15 | 0.03× | +219% |
| 177 |  Madagascar |
0.15 | 0.03× | +94.5% |
| 178 |  Chad |
0.14 | 0.03× | +262% |
| 179 |  Niger |
0.12 | 0.02× | +58.8% |
| 180 |  Burundi |
0.07 | 0.01× | +91.9% |
| 181 |  CAR |
0.06 | 0.01× | +14.1% |
| 182 |  DR Congo |
0.06 | 0.01× | −38.2% |
| 183 |  Somalia |
0.05 | 0.009× | −48.7% |
The list ranks 183 countries by their latest CO2 emissions per capita, from Qatar (47.3 tonnes per person) to Somalia (0.0455 tonnes). The world emits 4.87 tonnes of CO2 per person. Half of the countries emit less than 2.57 tonnes per person.
CO2 emissions per capita are a country's yearly emissions of carbon dioxide from fossil fuels and industry divided by its population: the tonnes released per resident. Dividing by the population lets countries of very different sizes be compared; the change is measured from 1990.
CO2 emissions per capita by country map
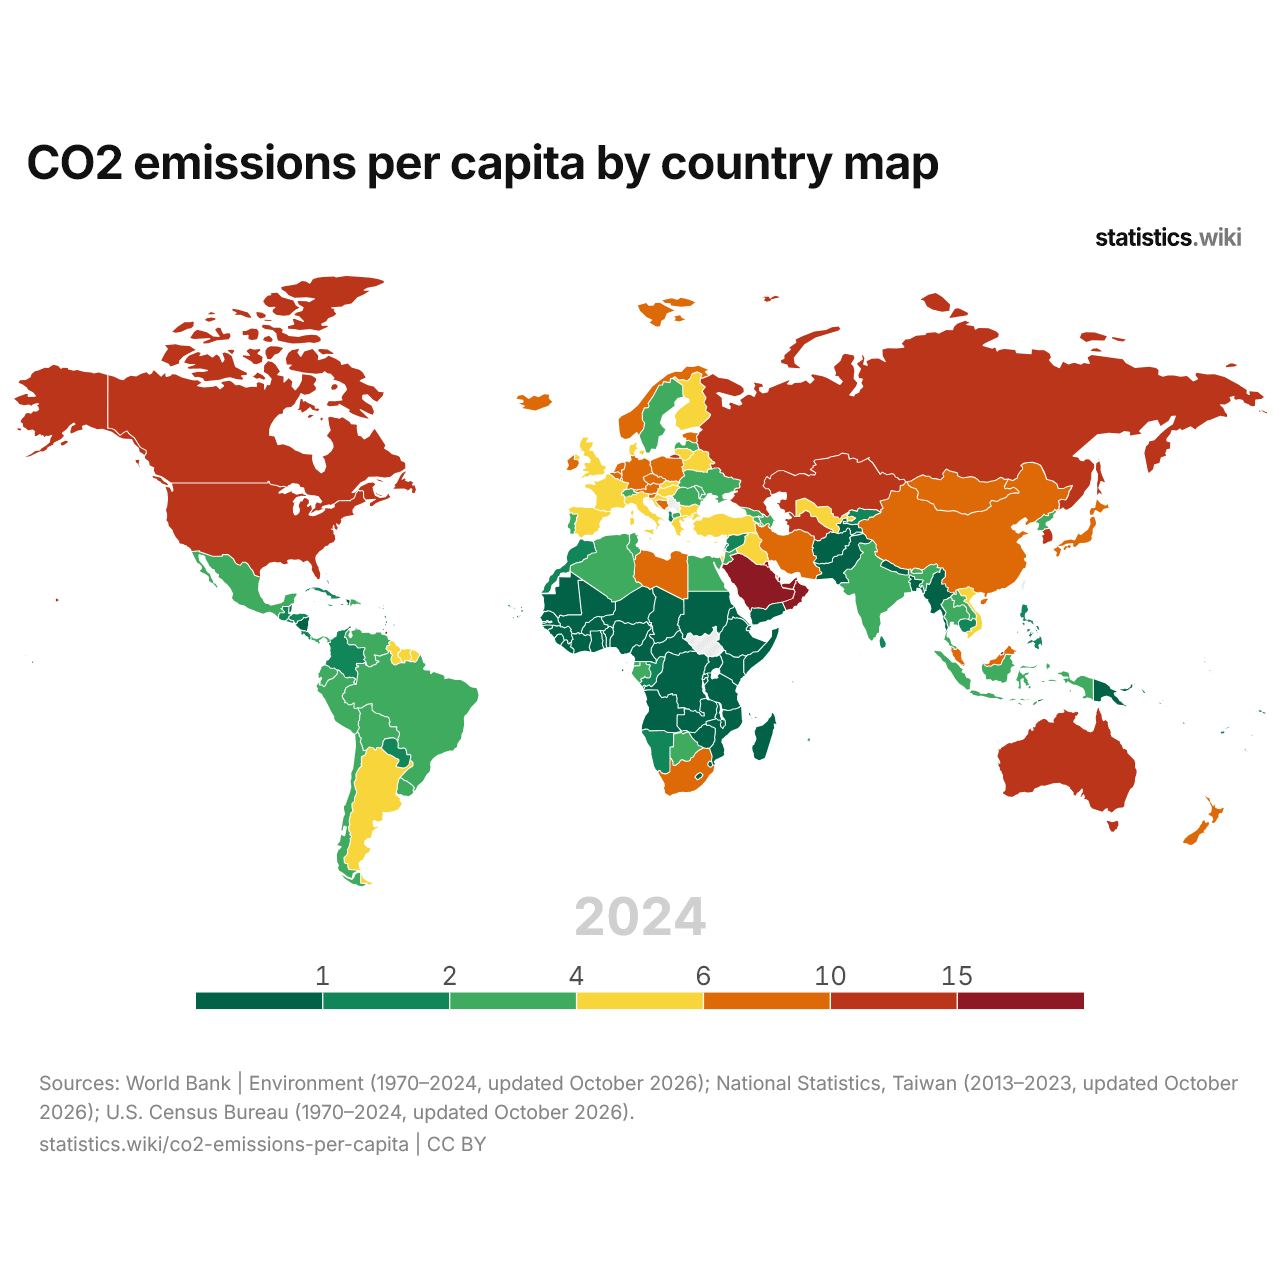
CO2 emissions per person are above 10 tonnes in 16 countries and below 1 tonne in 54; in 1970, the numbers were 22 and 84.
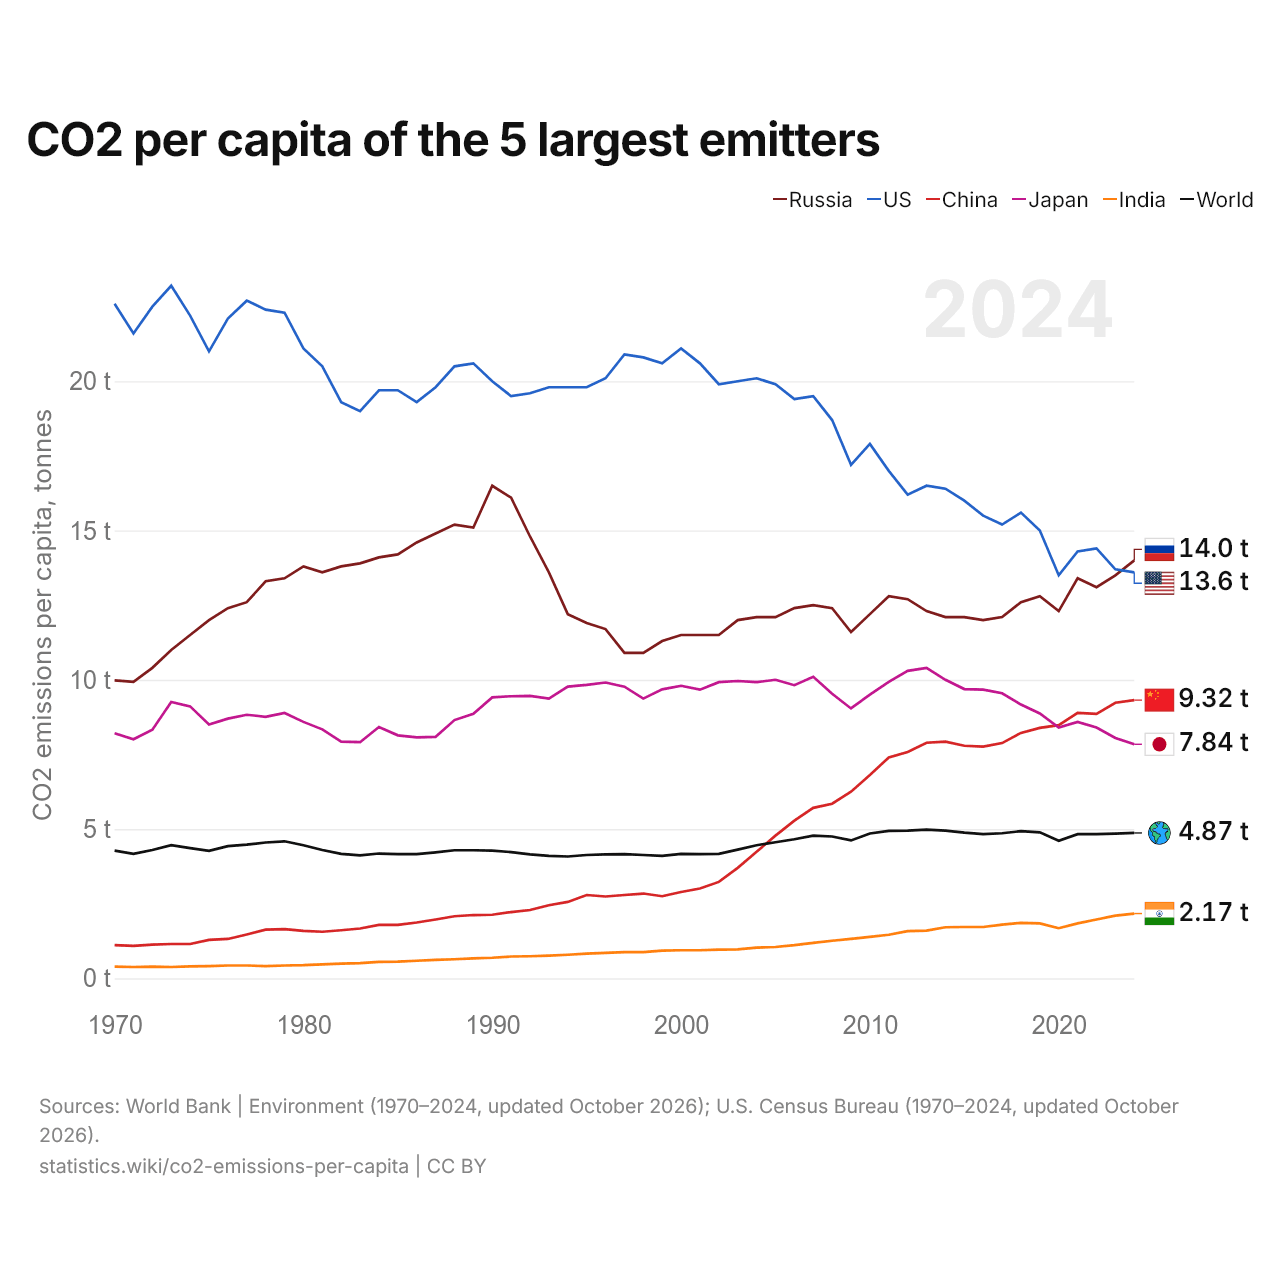
CO2 per capita of the 5 largest emitters
| Year | CO2 emissions per capita, tonnes | |||||
|---|---|---|---|---|---|---|
| Russia | United States | China | Japan | India | World | |
| 2024 | 14 t | 13.6 t | 9.32 t | 7.84 t | 2.17 t | 4.87 t |
| 2023 | 13.5 t | 13.7 t | 9.23 t | 8.05 t | 2.1 t | 4.85 t |
| 2022 | 13.1 t | 14.4 t | 8.86 t | 8.4 t | 1.97 t | 4.83 t |
| 2021 | 13.4 t | 14.3 t | 8.89 t | 8.59 t | 1.84 t | 4.83 t |
| 2020 | 12.3 t | 13.5 t | 8.48 t | 8.4 t | 1.68 t | 4.61 t |
| 2019 | 12.8 t | 15 t | 8.39 t | 8.87 t | 1.84 t | 4.89 t |
| 2018 | 12.6 t | 15.6 t | 8.22 t | 9.17 t | 1.86 t | 4.93 t |
| 2017 | 12.1 t | 15.2 t | 7.88 t | 9.55 t | 1.8 t | 4.86 t |
| 2016 | 12 t | 15.5 t | 7.76 t | 9.67 t | 1.72 t | 4.83 t |
| 2015 | 12.1 t | 16 t | 7.79 t | 9.69 t | 1.72 t | 4.88 t |
| 2014 | 12.1 t | 16.4 t | 7.93 t | 10 t | 1.71 t | 4.95 t |
| 2013 | 12.3 t | 16.5 t | 7.89 t | 10.4 t | 1.6 t | 4.98 t |
| 2012 | 12.7 t | 16.2 t | 7.58 t | 10.3 t | 1.58 t | 4.95 t |
| 2011 | 12.8 t | 17 t | 7.4 t | 9.93 t | 1.46 t | 4.94 t |
| 2010 | 12.2 t | 17.9 t | 6.81 t | 9.5 t | 1.39 t | 4.85 t |
| 2009 | 11.6 t | 17.2 t | 6.25 t | 9.04 t | 1.32 t | 4.62 t |
| 2008 | 12.4 t | 18.7 t | 5.85 t | 9.53 t | 1.26 t | 4.75 t |
| 2007 | 12.5 t | 19.5 t | 5.71 t | 10.1 t | 1.19 t | 4.78 t |
| 2006 | 12.4 t | 19.4 t | 5.28 t | 9.82 t | 1.11 t | 4.66 t |
| 2005 | 12.1 t | 19.9 t | 4.78 t | 10 t | 1.05 t | 4.56 t |
| 2004 | 12.1 t | 20.1 t | 4.24 t | 9.92 t | 1.03 t | 4.46 t |
| 2003 | 12 t | 20 t | 3.7 t | 9.96 t | 0.97 t | 4.31 t |
| 2002 | 11.5 t | 19.9 t | 3.23 t | 9.92 t | 0.96 t | 4.17 t |
| 2001 | 11.5 t | 20.6 t | 3.01 t | 9.67 t | 0.94 t | 4.16 t |
| 2000 | 11.5 t | 21.1 t | 2.89 t | 9.8 t | 0.94 t | 4.17 t |
| 1999 | 11.3 t | 20.6 t | 2.75 t | 9.68 t | 0.93 t | 4.1 t |
| 1998 | 10.9 t | 20.8 t | 2.84 t | 9.37 t | 0.88 t | 4.13 t |
| 1997 | 10.9 t | 20.9 t | 2.79 t | 9.77 t | 0.88 t | 4.16 t |
| 1996 | 11.7 t | 20.1 t | 2.74 t | 9.91 t | 0.85 t | 4.15 t |
| 1995 | 11.9 t | 19.8 t | 2.79 t | 9.83 t | 0.83 t | 4.13 t |
| 1994 | 12.2 t | 19.8 t | 2.56 t | 9.77 t | 0.79 t | 4.08 t |
| 1993 | 13.6 t | 19.8 t | 2.45 t | 9.37 t | 0.76 t | 4.1 t |
| 1992 | 14.8 t | 19.6 t | 2.29 t | 9.46 t | 0.74 t | 4.15 t |
| 1991 | 16.1 t | 19.5 t | 2.22 t | 9.45 t | 0.73 t | 4.23 t |
| 1990 | 16.5 t | 20 t | 2.13 t | 9.41 t | 0.69 t | 4.28 t |
| 1989 | 15.1 t | 20.6 t | 2.12 t | 8.86 t | 0.67 t | 4.29 t |
| 1988 | 15.2 t | 20.5 t | 2.08 t | 8.65 t | 0.64 t | 4.29 t |
| 1987 | 14.9 t | 19.8 t | 1.97 t | 8.09 t | 0.62 t | 4.22 t |
| 1986 | 14.6 t | 19.3 t | 1.87 t | 8.07 t | 0.59 t | 4.16 t |
| 1985 | 14.2 t | 19.7 t | 1.79 t | 8.14 t | 0.56 t | 4.16 t |
| 1984 | 14.1 t | 19.7 t | 1.79 t | 8.42 t | 0.55 t | 4.18 t |
| 1983 | 13.9 t | 19 t | 1.67 t | 7.91 t | 0.51 t | 4.12 t |
| 1982 | 13.8 t | 19.3 t | 1.61 t | 7.93 t | 0.49 t | 4.17 t |
| 1981 | 13.6 t | 20.5 t | 1.56 t | 8.34 t | 0.47 t | 4.3 t |
| 1980 | 13.8 t | 21.1 t | 1.59 t | 8.59 t | 0.44 t | 4.46 t |
| 1979 | 13.4 t | 22.3 t | 1.65 t | 8.89 t | 0.43 t | 4.59 t |
| 1978 | 13.3 t | 22.4 t | 1.63 t | 8.76 t | 0.41 t | 4.55 t |
| 1977 | 12.6 t | 22.7 t | 1.47 t | 8.83 t | 0.43 t | 4.48 t |
| 1976 | 12.4 t | 22.1 t | 1.32 t | 8.7 t | 0.43 t | 4.43 t |
| 1975 | 12 t | 21 t | 1.29 t | 8.5 t | 0.41 t | 4.27 t |
| 1974 | 11.5 t | 22.2 t | 1.15 t | 9.11 t | 0.4 t | 4.36 t |
| 1973 | 11 t | 23.2 t | 1.15 t | 9.26 t | 0.38 t | 4.46 t |
| 1972 | 10.4 t | 22.5 t | 1.13 t | 8.33 t | 0.39 t | 4.3 t |
| 1971 | 9.93 t | 21.6 t | 1.09 t | 8.01 t | 0.38 t | 4.17 t |
| 1970 | 9.98 t | 22.6 t | 1.11 t | 8.21 t | 0.39 t | 4.28 t |
CO2 emissions per person are 14 tonnes in Russia, 13.6 in the United States, 9.32 in China, 7.84 in Japan and 2.17 in India. The most recent change in their order came in 2024, when Russia's emissions per person passed the United States'.
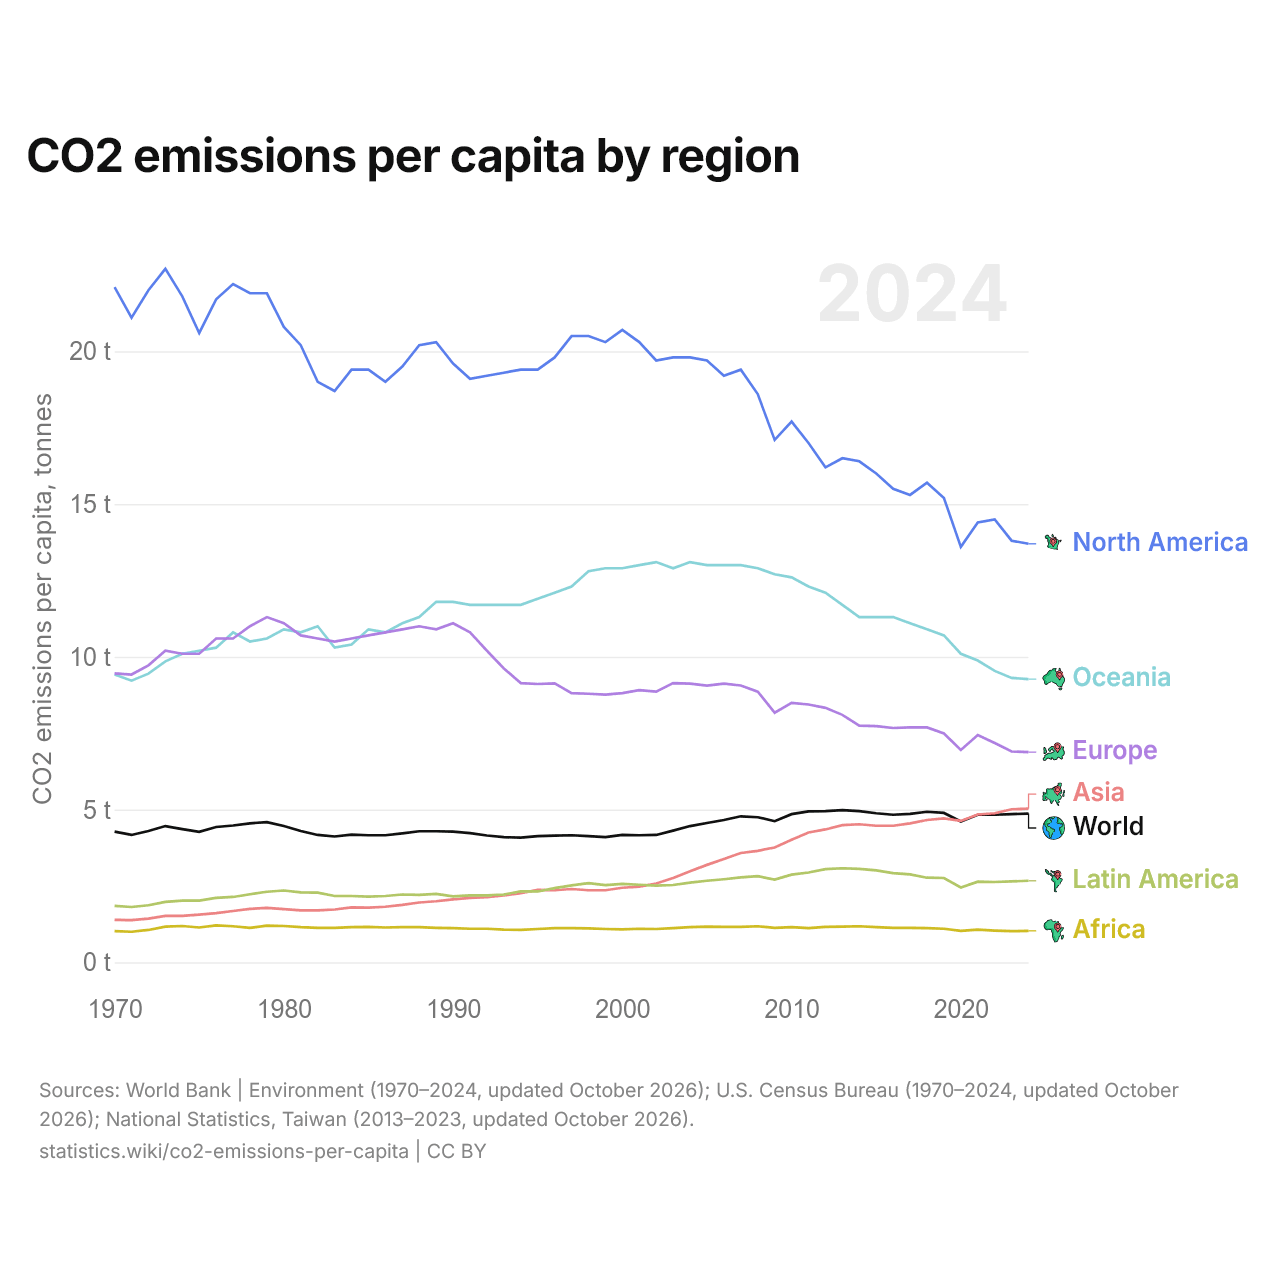
CO2 emissions per capita by region
| Year | CO2 emissions per capita, tonnes | ||||||
|---|---|---|---|---|---|---|---|
| World | North America | Oceania | Europe | Asia | Latin America | Africa | |
| 2024 | 4.87 t | 13.7 t | 9.27 t | 6.88 t | 5.03 t | 2.67 t | 1.03 t |
| 2023 | 4.85 t | 13.8 t | 9.31 t | 6.9 t | 5.01 t | 2.65 t | 1.02 t |
| 2022 | 4.83 t | 14.5 t | 9.54 t | 7.18 t | 4.88 t | 2.63 t | 1.04 t |
| 2021 | 4.83 t | 14.4 t | 9.88 t | 7.44 t | 4.84 t | 2.64 t | 1.07 t |
| 2020 | 4.61 t | 13.6 t | 10.1 t | 6.95 t | 4.63 t | 2.45 t | 1.03 t |
| 2019 | 4.89 t | 15.2 t | 10.7 t | 7.49 t | 4.71 t | 2.76 t | 1.1 t |
| 2018 | 4.93 t | 15.7 t | 10.9 t | 7.69 t | 4.66 t | 2.77 t | 1.12 t |
| 2017 | 4.86 t | 15.3 t | 11.1 t | 7.69 t | 4.55 t | 2.88 t | 1.13 t |
| 2016 | 4.83 t | 15.5 t | 11.3 t | 7.67 t | 4.47 t | 2.92 t | 1.13 t |
| 2015 | 4.88 t | 16 t | 11.3 t | 7.73 t | 4.47 t | 3.01 t | 1.15 t |
| 2014 | 4.95 t | 16.4 t | 11.3 t | 7.75 t | 4.52 t | 3.06 t | 1.18 t |
| 2013 | 4.98 t | 16.5 t | 11.7 t | 8.1 t | 4.49 t | 3.08 t | 1.17 t |
| 2012 | 4.95 t | 16.2 t | 12.1 t | 8.33 t | 4.35 t | 3.05 t | 1.16 t |
| 2011 | 4.94 t | 17 t | 12.3 t | 8.44 t | 4.25 t | 2.94 t | 1.12 t |
| 2010 | 4.85 t | 17.7 t | 12.6 t | 8.49 t | 4.01 t | 2.87 t | 1.15 t |
| 2009 | 4.62 t | 17.1 t | 12.7 t | 8.17 t | 3.76 t | 2.71 t | 1.13 t |
| 2008 | 4.75 t | 18.6 t | 12.9 t | 8.86 t | 3.65 t | 2.82 t | 1.18 t |
| 2007 | 4.78 t | 19.4 t | 13 t | 9.06 t | 3.58 t | 2.78 t | 1.16 t |
| 2006 | 4.66 t | 19.2 t | 13 t | 9.12 t | 3.38 t | 2.72 t | 1.16 t |
| 2005 | 4.56 t | 19.7 t | 13 t | 9.06 t | 3.19 t | 2.67 t | 1.17 t |
| 2004 | 4.46 t | 19.8 t | 13.1 t | 9.12 t | 2.98 t | 2.61 t | 1.15 t |
| 2003 | 4.31 t | 19.8 t | 12.9 t | 9.14 t | 2.76 t | 2.53 t | 1.12 t |
| 2002 | 4.17 t | 19.7 t | 13.1 t | 8.86 t | 2.58 t | 2.51 t | 1.09 t |
| 2001 | 4.16 t | 20.3 t | 13 t | 8.91 t | 2.48 t | 2.54 t | 1.1 t |
| 2000 | 4.17 t | 20.7 t | 12.9 t | 8.81 t | 2.44 t | 2.57 t | 1.08 t |
| 1999 | 4.1 t | 20.3 t | 12.9 t | 8.76 t | 2.36 t | 2.53 t | 1.09 t |
| 1998 | 4.13 t | 20.5 t | 12.8 t | 8.79 t | 2.36 t | 2.59 t | 1.11 t |
| 1997 | 4.16 t | 20.5 t | 12.3 t | 8.81 t | 2.4 t | 2.52 t | 1.12 t |
| 1996 | 4.15 t | 19.8 t | 12.1 t | 9.13 t | 2.36 t | 2.43 t | 1.12 t |
| 1995 | 4.13 t | 19.4 t | 11.9 t | 9.11 t | 2.37 t | 2.32 t | 1.09 t |
| 1994 | 4.08 t | 19.4 t | 11.7 t | 9.14 t | 2.26 t | 2.32 t | 1.06 t |
| 1993 | 4.1 t | 19.3 t | 11.7 t | 9.62 t | 2.19 t | 2.22 t | 1.07 t |
| 1992 | 4.15 t | 19.2 t | 11.7 t | 10.2 t | 2.13 t | 2.19 t | 1.1 t |
| 1991 | 4.23 t | 19.1 t | 11.7 t | 10.8 t | 2.11 t | 2.19 t | 1.1 t |
| 1990 | 4.28 t | 19.6 t | 11.8 t | 11.1 t | 2.06 t | 2.16 t | 1.12 t |
| 1989 | 4.29 t | 20.3 t | 11.8 t | 10.9 t | 2 t | 2.24 t | 1.13 t |
| 1988 | 4.29 t | 20.2 t | 11.3 t | 11 t | 1.96 t | 2.21 t | 1.15 t |
| 1987 | 4.22 t | 19.5 t | 11.1 t | 10.9 t | 1.88 t | 2.22 t | 1.15 t |
| 1986 | 4.16 t | 19 t | 10.8 t | 10.8 t | 1.82 t | 2.17 t | 1.14 t |
| 1985 | 4.16 t | 19.4 t | 10.9 t | 10.7 t | 1.79 t | 2.15 t | 1.16 t |
| 1984 | 4.18 t | 19.4 t | 10.4 t | 10.6 t | 1.8 t | 2.17 t | 1.15 t |
| 1983 | 4.12 t | 18.7 t | 10.3 t | 10.5 t | 1.73 t | 2.17 t | 1.13 t |
| 1982 | 4.17 t | 19 t | 11 t | 10.6 t | 1.7 t | 2.28 t | 1.13 t |
| 1981 | 4.3 t | 20.2 t | 10.8 t | 10.7 t | 1.7 t | 2.29 t | 1.15 t |
| 1980 | 4.46 t | 20.8 t | 10.9 t | 11.1 t | 1.74 t | 2.35 t | 1.19 t |
| 1979 | 4.59 t | 21.9 t | 10.6 t | 11.3 t | 1.78 t | 2.31 t | 1.2 t |
| 1978 | 4.55 t | 21.9 t | 10.5 t | 11 t | 1.75 t | 2.23 t | 1.13 t |
| 1977 | 4.48 t | 22.2 t | 10.8 t | 10.6 t | 1.68 t | 2.14 t | 1.18 t |
| 1976 | 4.43 t | 21.7 t | 10.3 t | 10.6 t | 1.61 t | 2.11 t | 1.21 t |
| 1975 | 4.27 t | 20.6 t | 10.2 t | 10.1 t | 1.56 t | 2.02 t | 1.14 t |
| 1974 | 4.36 t | 21.8 t | 10.1 t | 10.1 t | 1.52 t | 2.02 t | 1.19 t |
| 1973 | 4.46 t | 22.7 t | 9.85 t | 10.2 t | 1.52 t | 1.98 t | 1.17 t |
| 1972 | 4.3 t | 22 t | 9.45 t | 9.72 t | 1.43 t | 1.87 t | 1.06 t |
| 1971 | 4.17 t | 21.1 t | 9.22 t | 9.42 t | 1.38 t | 1.81 t | 1 t |
| 1970 | 4.28 t | 22.1 t | 9.42 t | 9.46 t | 1.39 t | 1.85 t | 1.02 t |
CO2 emissions per person are highest in North America, at 13.7 tonnes, and lowest in Africa, at 1.03. The world's emissions per person have risen from 4.28 tonnes in 1970 to 4.87.
Compare the CO2 emissions per capita of any 2 countries
Sources:
- World Bank | Environment (1970–2024, updated October 2026)
- National Statistics, Taiwan (2013–2023, updated October 2026)
- U.S. Census Bureau (1970–2024, updated October 2026)
Creative Commons Attribution (CC BY): you may copy, share, adapt and reuse this content, also commercially, as long as you credit statistics.wiki and note any changes you made. The sources listed above may have their own license terms.