
Djibouti CO2 emissions per capita
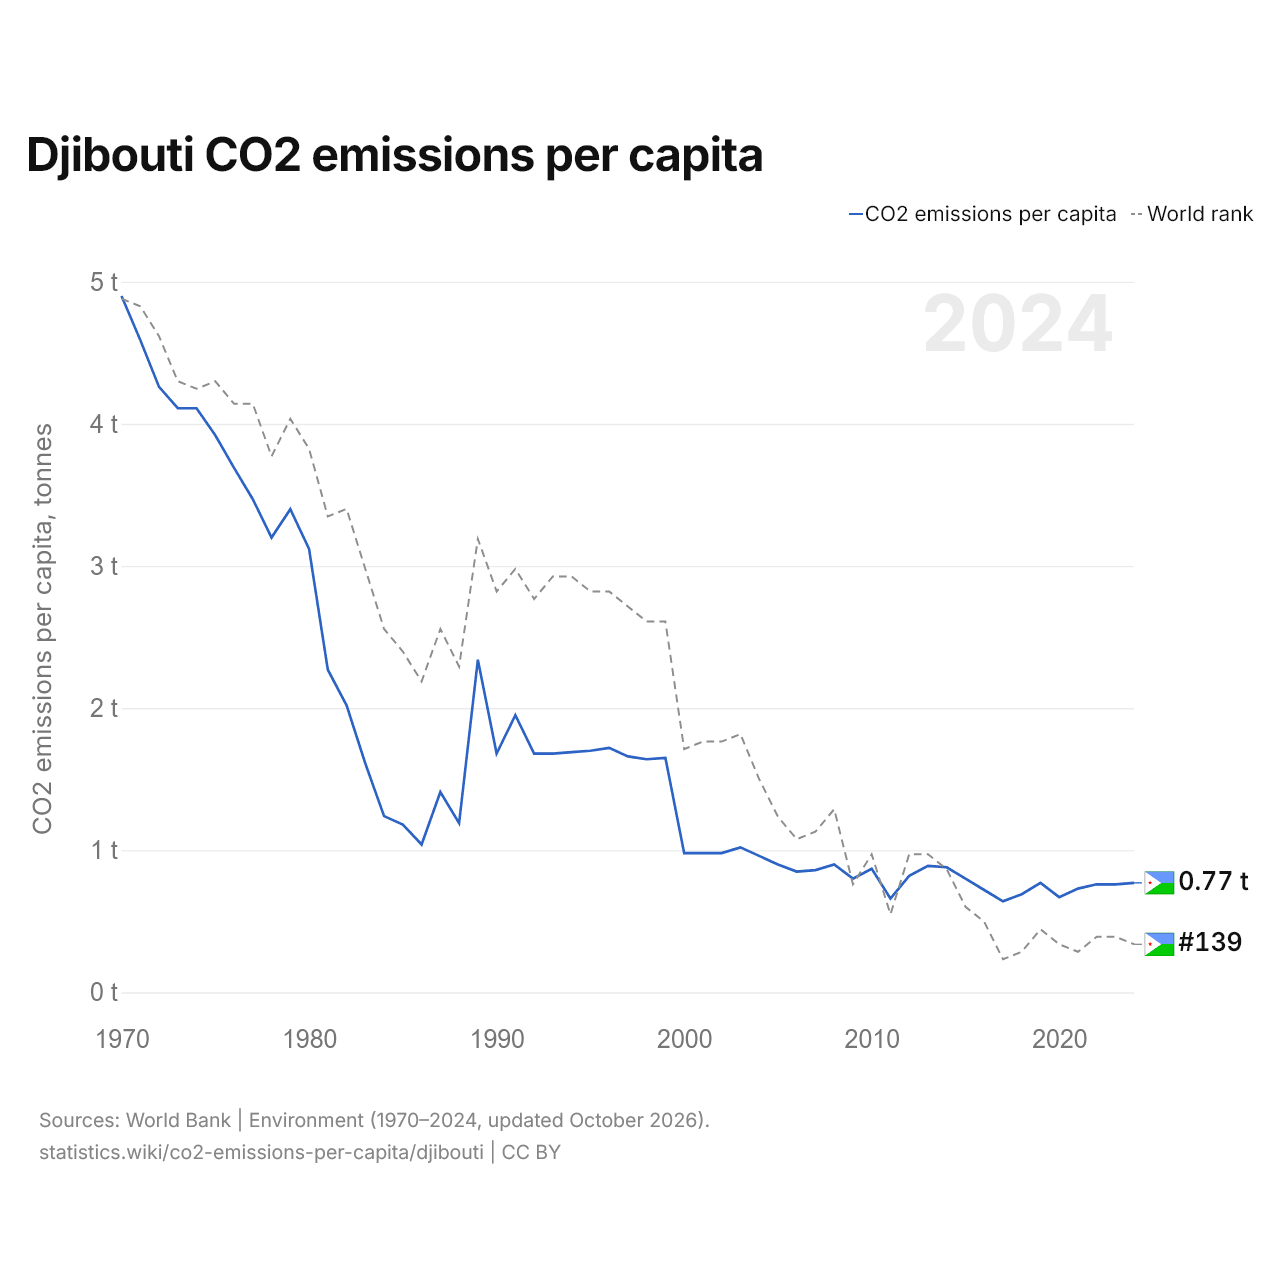
| Year | CO2 emissions per capita, tonnes | World rank |
|---|---|---|
| 2024 | 0.77 t | #139 |
| 2023 | 0.76 t | #138 |
| 2022 | 0.76 t | #138 |
| 2021 | 0.73 t | #140 |
| 2020 | 0.67 t | #139 |
| 2019 | 0.77 t | #137 |
| 2018 | 0.69 t | #140 |
| 2017 | 0.64 t | #141 |
| 2016 | 0.72 t | #136 |
| 2015 | 0.8 t | #134 |
| 2014 | 0.88 t | #129 |
| 2013 | 0.89 t | #127 |
| 2012 | 0.82 t | #127 |
| 2011 | 0.66 t | #135 |
| 2010 | 0.87 t | #127 |
| 2009 | 0.8 t | #131 |
| 2008 | 0.9 t | #121 |
| 2007 | 0.86 t | #124 |
| 2006 | 0.85 t | #125 |
| 2005 | 0.9 t | #122 |
| 2004 | 0.96 t | #117 |
| 2003 | 1.02 t | #111 |
| 2002 | 0.98 t | #112 |
| 2001 | 0.98 t | #112 |
| 2000 | 0.98 t | #113 |
| 1999 | 1.65 t | #96 |
| 1998 | 1.64 t | #96 |
| 1997 | 1.66 t | #94 |
| 1996 | 1.72 t | #92 |
| 1995 | 1.7 t | #92 |
| 1994 | 1.69 t | #90 |
| 1993 | 1.68 t | #90 |
| 1992 | 1.68 t | #93 |
| 1991 | 1.95 t | #89 |
| 1990 | 1.68 t | #92 |
| 1989 | 2.34 t | #85 |
| 1988 | 1.19 t | #102 |
| 1987 | 1.41 t | #97 |
| 1986 | 1.04 t | #104 |
| 1985 | 1.18 t | #100 |
| 1984 | 1.24 t | #97 |
| 1983 | 1.61 t | #89 |
| 1982 | 2.02 t | #81 |
| 1981 | 2.27 t | #82 |
| 1980 | 3.12 t | #73 |
| 1979 | 3.4 t | #69 |
| 1978 | 3.2 t | #74 |
| 1977 | 3.47 t | #67 |
| 1976 | 3.69 t | #67 |
| 1975 | 3.92 t | #64 |
| 1974 | 4.11 t | #65 |
| 1973 | 4.11 t | #64 |
| 1972 | 4.26 t | #58 |
| 1971 | 4.59 t | #54 |
| 1970 | 4.9 t | #53 |
CO2 emissions per person in Djibouti are 0.766 tonnes, down from 4.9 in 1970. Djibouti's are 16% of the world's 4.87 tonnes per person. Its emissions per person were lowest in 2017, at 0.641 tonnes. It is the 139th highest in the world, down from 138th the year before. Its highest rank was 53rd, last held in 1970.
Djibouti's CO2 emissions per person are the 19th highest of 53 countries in Africa, where they range from Somalia's 0.0455 tonnes to Libya's 8.66 tonnes.
Djibouti's carbon intensity of GDP is 0.111 kg of CO2 per dollar, the 107th highest in the world. Energy consumption in Djibouti is 1,902 kWh per person (2007).
Djibouti CO2 emissions per capita by decade
| Year | CO2 emissions per capita, tonnes | Change since 1990 | × world average |
|---|---|---|---|
| 1970 | 4.9 | 1.15× | |
| 1980 | 3.12 | 0.7× | |
| 1990 | 1.68 | 0.39× | |
| 2000 | 0.98 | −41.6% | 0.24× |
| 2010 | 0.87 | −48.1% | 0.18× |
| 2020 | 0.67 | −59.9% | 0.15× |
| 2024 | 0.77 | −54.5% | 0.16× |
Djibouti in the world CO2 emissions per capita ranking







Compare Djibouti CO2 emissions per capita with other countries
Sources:
- World Bank | Environment (1970–2024, updated October 2026)
Creative Commons Attribution (CC BY): you may copy, share, adapt and reuse this content, also commercially, as long as you credit statistics.wiki and note any changes you made. The sources listed above may have their own license terms.