
Djibouti carbon intensity of GDP (kg CO2 per $, PPP, 2021 prices)
1x
| Year | kg CO2 per $ | World rank |
|---|---|---|
| 2024 | 0.111 kg | #107 |
| 2023 | 0.117 kg | #102 |
| 2022 | 0.123 kg | #100 |
| 2021 | 0.123 kg | #107 |
| 2020 | 0.117 kg | #110 |
| 2019 | 0.132 kg | #99 |
| 2018 | 0.123 kg | #109 |
| 2017 | 0.118 kg | #113 |
| 2016 | 0.137 kg | #98 |
| 2015 | 0.161 kg | #80 |
| 2014 | 0.187 kg | #62 |
| 2013 | 0.199 kg | #59 |
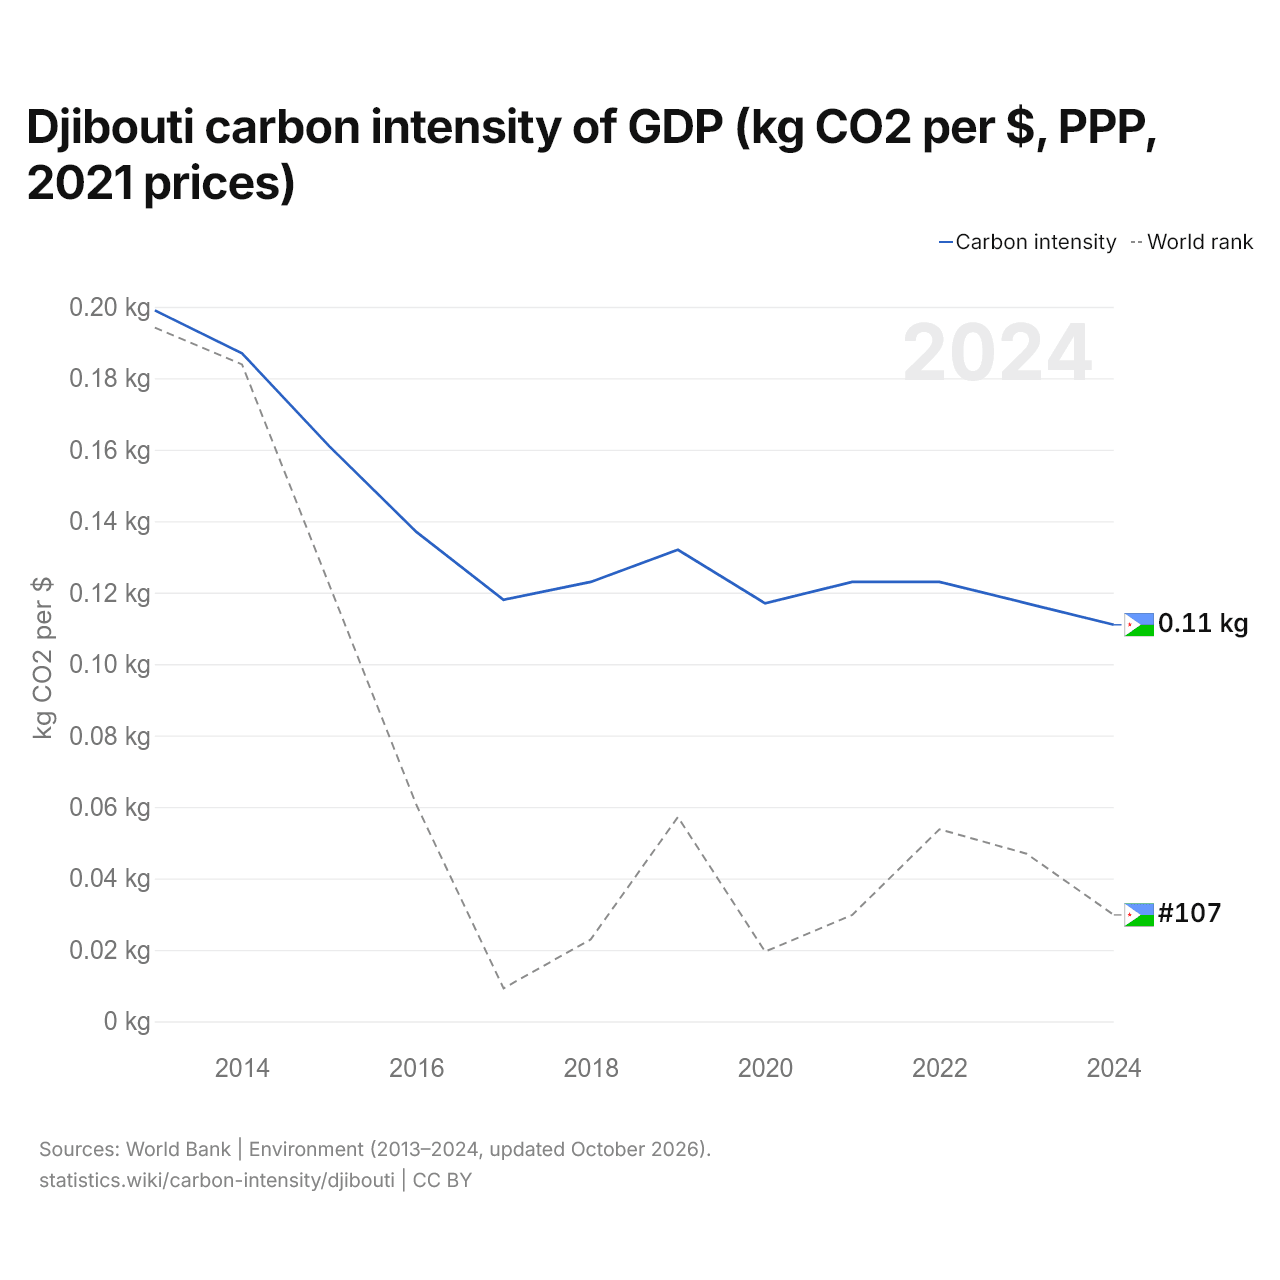
The carbon intensity of GDP in Djibouti is 0.111 kg of CO2 per dollar, down from 0.199 kg in 2013. Djibouti's is 50% of the world's 0.221 kg. It is the 107th highest in the world, down from 102nd the year before. Its highest rank was 59th, last held in 2013.
Djibouti's carbon intensity is the 25th highest of 52 countries in Africa, where it ranges from Somalia's 0.032 kg to Libya's 0.689 kg.
Djibouti in the world carbon intensity of GDP ranking







Compare Djibouti carbon intensity of GDP with other countries
Sources:
- World Bank | Environment (2013–2024, updated October 2026)
Creative Commons Attribution (CC BY): you may copy, share, adapt and reuse this content, also commercially, as long as you credit statistics.wiki and note any changes you made. The sources listed above may have their own license terms.