
Rwanda vs Djibouti carbon intensity of GDP (kg CO2 per $, PPP, 2021 prices)
1x
| Year | kg CO2 per $ | |
|---|---|---|
 Rwanda |
 Djibouti |
|
| 2024 | 0.049 kg | 0.111 kg |
| 2023 | 0.052 kg | 0.117 kg |
| 2022 | 0.054 kg | 0.123 kg |
| 2021 | 0.046 kg | 0.123 kg |
| 2020 | 0.043 kg | 0.117 kg |
| 2019 | 0.043 kg | 0.132 kg |
| 2018 | 0.045 kg | 0.123 kg |
| 2017 | 0.044 kg | 0.118 kg |
| 2016 | 0.043 kg | 0.137 kg |
| 2015 | 0.041 kg | 0.161 kg |
| 2014 | 0.039 kg | 0.187 kg |
| 2013 | 0.04 kg | 0.199 kg |
| 2012 | 0.038 kg | - |
| 2011 | 0.037 kg | - |
| 2010 | 0.038 kg | - |
| 2009 | 0.039 kg | - |
| 2008 | 0.041 kg | - |
| 2007 | 0.045 kg | - |
| 2006 | 0.053 kg | - |
| 2005 | 0.058 kg | - |
| 2004 | 0.059 kg | - |
| 2003 | 0.065 kg | - |
| 2002 | 0.077 kg | - |
| 2001 | 0.074 kg | - |
| 2000 | 0.079 kg | - |
| 1999 | 0.064 kg | - |
| 1998 | 0.065 kg | - |
| 1997 | 0.068 kg | - |
| 1996 | 0.076 kg | - |
| 1995 | 0.086 kg | - |
| 1994 | 0.118 kg | - |
| 1993 | 0.061 kg | - |
| 1992 | 0.056 kg | - |
| 1991 | 0.059 kg | - |
| 1990 | 0.064 kg | - |
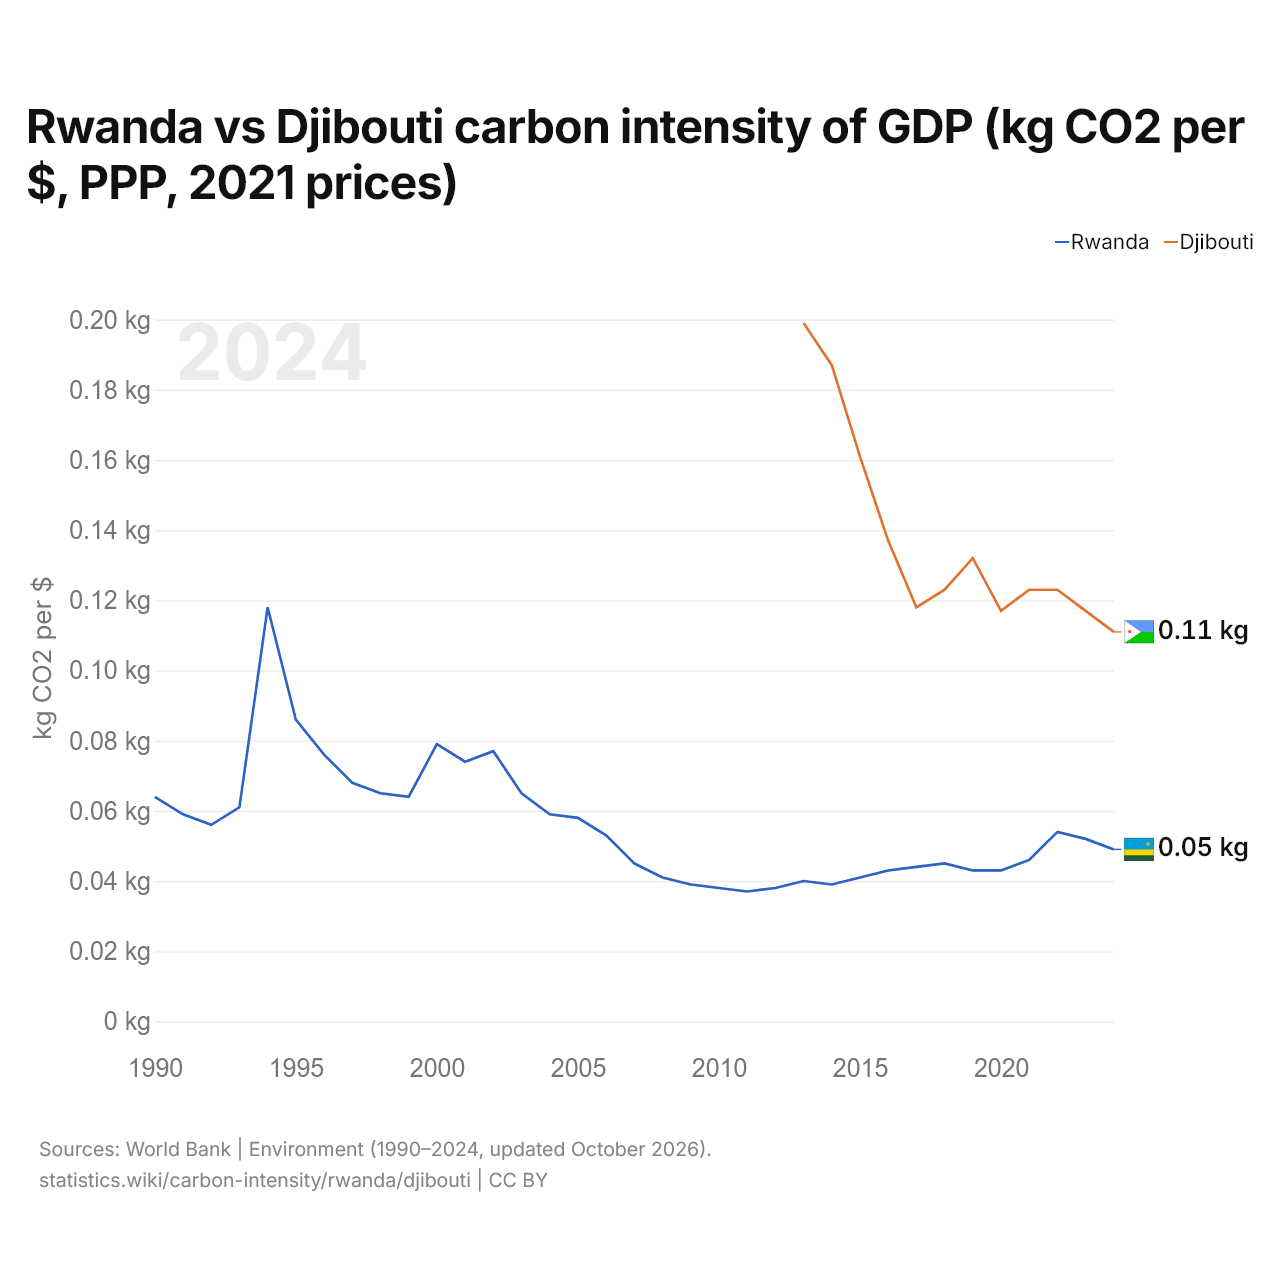
Carbon intensity is 0.049 kg of CO2 per dollar of GDP in Rwanda and 0.111 kg in Djibouti: 0.062 kg more in Djibouti. In 2013, Rwanda emitted 0.040 kg and Djibouti 0.199 kg, a difference of 0.159 kg.
Djibouti's carbon intensity has been higher than Rwanda's every year since 2013.
Rwanda vs Djibouti: latest carbon intensity of GDP
Compare the carbon intensity of GDP of any 2 countries
Sources:
- World Bank | Environment (1990–2024, updated October 2026)
Creative Commons Attribution (CC BY): you may copy, share, adapt and reuse this content, also commercially, as long as you credit statistics.wiki and note any changes you made. The sources listed above may have their own license terms.