
List of countries by GDP per capita (2025)
| Rank | Country | GDP per capita, current $ | × world average |
|---|---|---|---|
 World |
$14,406 | ||
| 1 |  Monaco |
$288,002 (2024) | 21× |
| 2 |  Liechtenstein |
$220,167 (2024) | 16.1× |
| 3 |  Luxembourg |
$147,252 | 10.2× |
| 4 |  Ireland |
$131,592 | 9.13× |
| 5 |  Switzerland |
$114,769 | 7.97× |
| 6 |  Cayman Islands |
$104,293 (2024) | 7.6× |
| 7 |  Singapore |
$98,814 | 6.86× |
| 8 |  Iceland |
$98,323 | 6.83× |
| 9 |  Norway |
$94,594 | 6.57× |
| 10 |  United States |
$90,027 | 6.25× |
| 11 |  Denmark |
$76,970 | 5.34× |
| 12 |  Netherlands |
$73,684 | 5.11× |
| 13 |  Qatar |
$72,525 | 5.03× |
| 14 |  Australia |
$65,130 | 4.52× |
| 15 |  Sweden |
$63,133 | 4.38× |
| 16 |  Austria |
$62,930 | 4.37× |
| 17 |  Belgium |
$60,750 | 4.22× |
| 18 |  Germany |
$60,496 | 4.2× |
| 19 |  Israel |
$60,337 | 4.19× |
| 20 |  San Marino |
$59,871 (2023) | 4.5× |
| 21 |  United Kingdom |
$57,602 | 4× |
| 22 |  Finland |
$56,149 | 3.9× |
| 23 |  Canada |
$55,698 | 3.87× |
| 24 |  Andorra |
$54,292 | 3.77× |
| 25 |  UAE |
$50,274 (2024) | 3.67× |
| 26 |  New Zealand |
$49,591 | 3.44× |
| 27 |  France |
$48,986 | 3.4× |
| 28 |  Malta |
$47,907 | 3.33× |
| 29 |  Italy |
$43,309 | 3.01× |
| 30 |  Taiwan |
$39,506 | 2.74× |
| 31 |  Bahamas |
$39,455 (2024) | 2.88× |
| 32 |  Spain |
$38,627 | 2.68× |
| 33 |  Slovenia |
$37,376 | 2.59× |
| 34 |  South Korea |
$36,227 | 2.51× |
| 35 |  Japan |
$35,951 | 2.5× |
| 36 |  Czech Republic |
$35,917 | 2.49× |
| 37 |  Saudi Arabia |
$34,537 | 2.4× |
| 38 |  Estonia |
$34,418 | 2.39× |
| 39 |  Lithuania |
$32,959 | 2.29× |
| 40 |  Guyana |
$32,414 | 2.25× |
| 41 |  Kuwait |
$32,312 | 2.24× |
| 42 |  Brunei |
$32,235 | 2.24× |
| 43 |  Portugal |
$32,082 | 2.23× |
| 44 |  Bahrain |
$30,597 | 2.12× |
| 45 |  Cyprus |
$30,075 | 2.09× |
| 46 |  Slovakia |
$28,544 | 1.98× |
| 47 |  Poland |
$28,420 | 1.97× |
| 48 |  Barbados |
$28,365 | 1.97× |
| 49 |  Croatia |
$27,104 | 1.88× |
| 50 |  Greece |
$26,948 | 1.87× |
| 51 |  Latvia |
$26,312 | 1.83× |
| 52 |  Hungary |
$25,907 | 1.8× |
| 53 |  Saint Kitts |
$25,223 | 1.75× |
| 54 |  Uruguay |
$25,216 | 1.75× |
| 55 |  Antigua |
$24,819 | 1.72× |
| 56 |  Curacao |
$22,833 (2024) | 1.66× |
| 57 |  Romania |
$22,538 | 1.56× |
| 58 |  Bulgaria |
$20,328 | 1.41× |
| 59 |  Costa Rica |
$19,970 | 1.39× |
| 60 |  Oman |
$19,947 | 1.38× |
| 61 |  Vatican |
$19,800 (2026) | n/a |
| 62 |  Panama |
$19,790 | 1.37× |
| 63 |  Palau |
$19,532 | 1.36× |
| 64 |  Seychelles |
$19,449 | 1.35× |
| 65 |  Trinidad |
$18,967 | 1.32× |
| 66 |  Turkey |
$18,599 | 1.29× |
| 67 |  Chile |
$17,995 | 1.25× |
| 68 |  Russia |
$17,847 | 1.24× |
| 69 |  Serbia |
$15,262 | 1.06× |
| 70 |  Argentina |
$14,898 | 1.03× |
| 71 |  Montenegro |
$14,817 | 1.03× |
| 72 |  Saint Lucia |
$14,746 | 1.02× |
| 73 |  Kazakhstan |
$14,692 | 1.02× |
| 74 |  Nauru |
$14,640 | 1.02× |
| 75 |  Maldives |
$14,615 | 1.01× |
| 76 |  Mexico |
$13,889 | 0.96× |
| 77 |  China |
$13,862 | 0.96× |
| 78 |  Malaysia |
$13,125 | 0.91× |
| 79 |  Albania |
$12,998 | 0.9× |
| 80 |  Mauritius |
$12,991 | 0.9× |
| 81 |  Saint Vincent |
$12,562 | 0.87× |
| 82 |  Grenada |
$12,107 | 0.84× |
| 83 |  Dominican Republic |
$11,059 | 0.77× |
| 84 |  Dominica |
$10,989 | 0.76× |
| 85 |  Brazil |
$10,713 | 0.74× |
| 86 |  North Macedonia |
$10,490 | 0.73× |
| 87 |  Bosnia |
$10,382 | 0.72× |
| 88 |  Belarus |
$10,279 | 0.71× |
| 89 |  Georgia |
$9,692 | 0.67× |
| 90 |  Peru |
$9,684 | 0.67× |
| 91 |  Cuba |
$9,605 (2020) | 0.87× |
| 92 |  Armenia |
$9,474 | 0.66× |
| 93 |  Moldova |
$8,622 | 0.6× |
| 94 |  Colombia |
$8,562 | 0.59× |
| 95 |  Marshall Islands |
$8,489 | 0.59× |
| 96 |  Gabon |
$8,263 | 0.57× |
| 97 |  Thailand |
$8,057 | 0.56× |
| 98 |  Jamaica |
$8,003 | 0.56× |
| 99 |  Belize |
$7,865 | 0.55× |
| 100 |  Botswana |
$7,778 | 0.54× |
| 101 |  Azerbaijan |
$7,411 | 0.51× |
| 102 |  Ecuador |
$7,125 | 0.49× |
| 103 |  Mongolia |
$7,108 | 0.49× |
| 104 |  Suriname |
$7,070 | 0.49× |
| 105 |  Paraguay |
$7,027 | 0.49× |
| 106 |  Fiji |
$6,642 | 0.46× |
| 107 |  Equatorial Guinea |
$6,615 | 0.46× |
| 108 |  Guatemala |
$6,598 | 0.46× |
| 109 |  South Africa |
$6,598 | 0.46× |
| 110 |  Tonga |
$6,547 | 0.45× |
| 111 |  Turkmenistan |
$6,540 | 0.45× |
| 112 |  Libya |
$6,449 | 0.45× |
| 113 |  Algeria |
$6,051 | 0.42× |
| 114 |  Tuvalu |
$6,041 | 0.42× |
| 115 |  Samoa |
$5,873 | 0.41× |
| 116 |  Cape Verde |
$5,796 | 0.4× |
| 117 |  El Salvador |
$5,767 | 0.4× |
| 118 |  Ukraine |
$5,496 | 0.38× |
| 119 |  Iraq |
$5,410 | 0.38× |
| 120 |  Jordan |
$5,348 | 0.37× |
| 121 |  Bolivia |
$5,148 | 0.36× |
| 122 |  Vietnam |
$5,066 | 0.35× |
| 123 |  Indonesia |
$5,060 | 0.35× |
| 124 |  Sri Lanka |
$5,002 | 0.35× |
| 125 |  Namibia |
$4,876 | 0.34× |
| 126 |  Morocco |
$4,746 | 0.33× |
| 127 |  Tunisia |
$4,657 | 0.32× |
| 128 |  Bhutan |
$4,493 | 0.31× |
| 129 |  Lebanon |
$4,473 (2024) | 0.33× |
| 130 |  Philippines |
$4,171 | 0.29× |
| 131 |  Eswatini |
$4,108 | 0.29× |
| 132 |  Sao Tome |
$4,084 | 0.28× |
| 133 |  Vanuatu |
$4,039 | 0.28× |
| 134 |  Uzbekistan |
$3,968 | 0.28× |
| 135 |  Iran |
$3,924 | 0.27× |
| 136 |  Djibouti |
$3,906 | 0.27× |
| 137 |  Honduras |
$3,598 | 0.25× |
| 138 |  Venezuela |
$3,495 | 0.24× |
| 139 |  Ghana |
$3,257 | 0.23× |
| 140 |  Nicaragua |
$3,173 | 0.22× |
| 141 |  Palestine |
$3,171 | 0.22× |
| 142 |  Angola |
$3,129 | 0.22× |
| 143 |  Egypt |
$3,086 | 0.21× |
| 144 |  Kyrgyzstan |
$3,081 | 0.21× |
| 145 |  Ivory Coast |
$3,050 | 0.21× |
| 146 |  Zimbabwe |
$3,021 | 0.21× |
| 147 |  Papua New Guinea |
$3,020 | 0.21× |
| 148 |  Cambodia |
$2,872 | 0.2× |
| 149 |  India |
$2,702 | 0.19× |
| 150 |  Haiti |
$2,694 | 0.19× |
| 151 |  Bangladesh |
$2,597 | 0.18× |
| 152 |  Kiribati |
$2,559 | 0.18× |
| 153 |  Congo |
$2,515 | 0.17× |
| 154 |  Kenya |
$2,363 | 0.16× |
| 155 |  Laos |
$2,325 | 0.16× |
| 156 |  Mauritania |
$2,198 | 0.15× |
| 157 |  Solomon Islands |
$2,086 | 0.14× |
| 158 |  Comoros |
$2,056 | 0.14× |
| 159 |  Cameroon |
$1,972 | 0.14× |
| 160 |  Senegal |
$1,955 | 0.14× |
| 161 |  Guinea |
$1,877 | 0.13× |
| 162 |  Benin |
$1,658 | 0.12× |
| 163 |  Tajikistan |
$1,637 | 0.11× |
| 164 |  Pakistan |
$1,596 | 0.11× |
| 165 |  Nepal |
$1,536 | 0.11× |
| 166 |  Myanmar |
$1,489 | 0.1× |
| 167 |  Togo |
$1,384 | 0.1× |
| 168 |  East Timor |
$1,341 | 0.09× |
| 169 |  North Korea |
$1,319 (2024) | 0.1× |
| 170 |  Zambia |
$1,318 | 0.09× |
| 171 |  Tanzania |
$1,278 | 0.09× |
| 172 |  Nigeria |
$1,224 | 0.08× |
| 173 |  Uganda |
$1,206 | 0.08× |
| 174 |  Mali |
$1,193 | 0.08× |
| 175 |  Sudan |
$1,165 | 0.08× |
| 176 |  Burkina Faso |
$1,148 | 0.08× |
| 177 |  Guinea-Bissau |
$1,124 | 0.08× |
| 178 |  Rwanda |
$1,124 | 0.08× |
| 179 |  Lesotho |
$1,089 | 0.08× |
| 180 |  South Sudan |
$1,080 (2015) | 0.11× |
| 181 |  Chad |
$1,022 | 0.07× |
| 182 |  Ethiopia |
$933 | 0.06× |
| 183 |  Gambia |
$919 | 0.06× |
| 184 |  Liberia |
$915 | 0.06× |
| 185 |  Syria |
$847 (2023) | 0.06× |
| 186 |  Sierra Leone |
$846 | 0.06× |
| 187 |  DR Congo |
$807 | 0.06× |
| 188 |  Niger |
$775 | 0.05× |
| 189 |  Eritrea |
$689 (2011) | 0.07× |
| 190 |  Malawi |
$672 | 0.05× |
| 191 |  Somalia |
$661 | 0.05× |
| 192 |  Yemen |
$634 (2018) | 0.06× |
| 193 |  Mozambique |
$627 | 0.04× |
| 194 |  Madagascar |
$599 | 0.04× |
| 195 |  CAR |
$556 | 0.04× |
| 196 |  Afghanistan |
$417 (2024) | 0.03× |
| 197 |  Burundi |
$233.8 | 0.02× |
The list ranks 197 countries by their latest GDP per capita, from Monaco ($288,002, 2024) to Burundi ($234). The world's GDP per capita was $14,406 in 2025. Half of the countries had a GDP per capita below $7,865.
At purchasing power parity, Singapore's GDP per capita (PPP) is the highest, at $163,354.
GDP per capita is a country's gross domestic product divided by its population: the value of the goods and services produced in a year, per person. The list gives it in nominal terms, in current US dollars, converted at each year's market exchange rate, so a country's figure also moves with its currency; the country pages add it in constant 2015 dollars, which shows the real change.
GDP per capita by country map
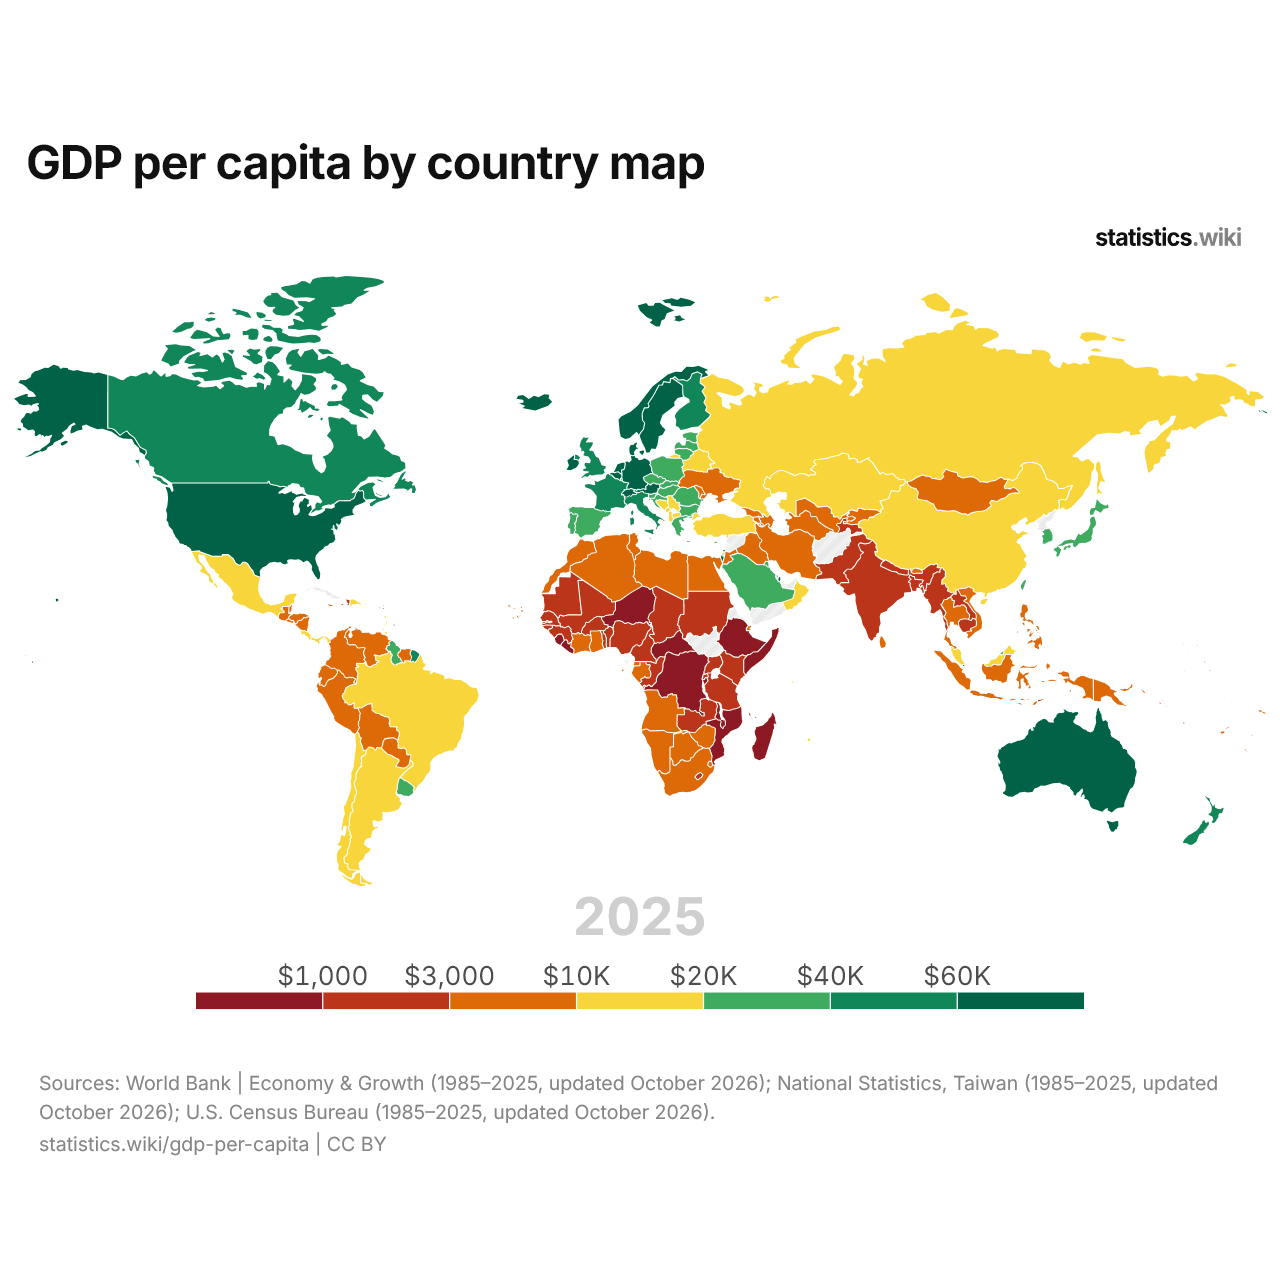
In 2025, GDP per capita was above $40,000 in 24 countries and below $1,000 in 12; in 1985, it was above $40,000 in 0 and below $1,000 in 72.
The 10 countries with the highest GDP per capita each year, 1985–2025
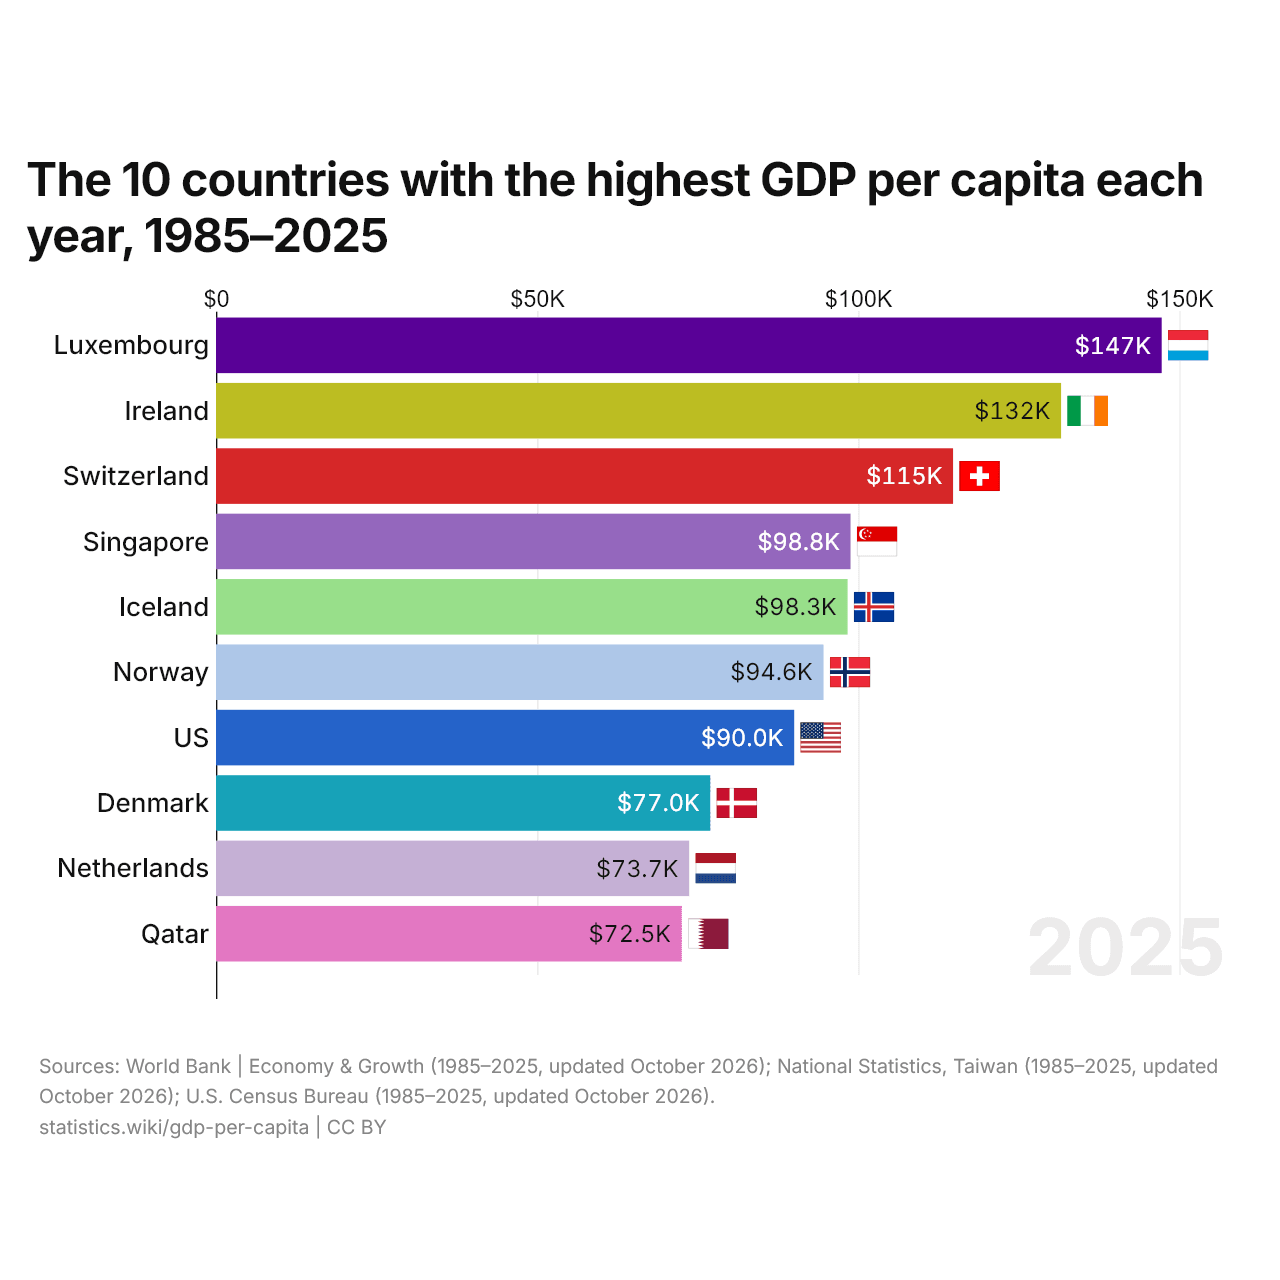
Luxembourg had the highest GDP per capita in 2025, $147,252; in 1985, the highest was Monaco, at $37,690. Ireland moved up the most among the ten of 2025, from 35th in 1985 to 2nd.
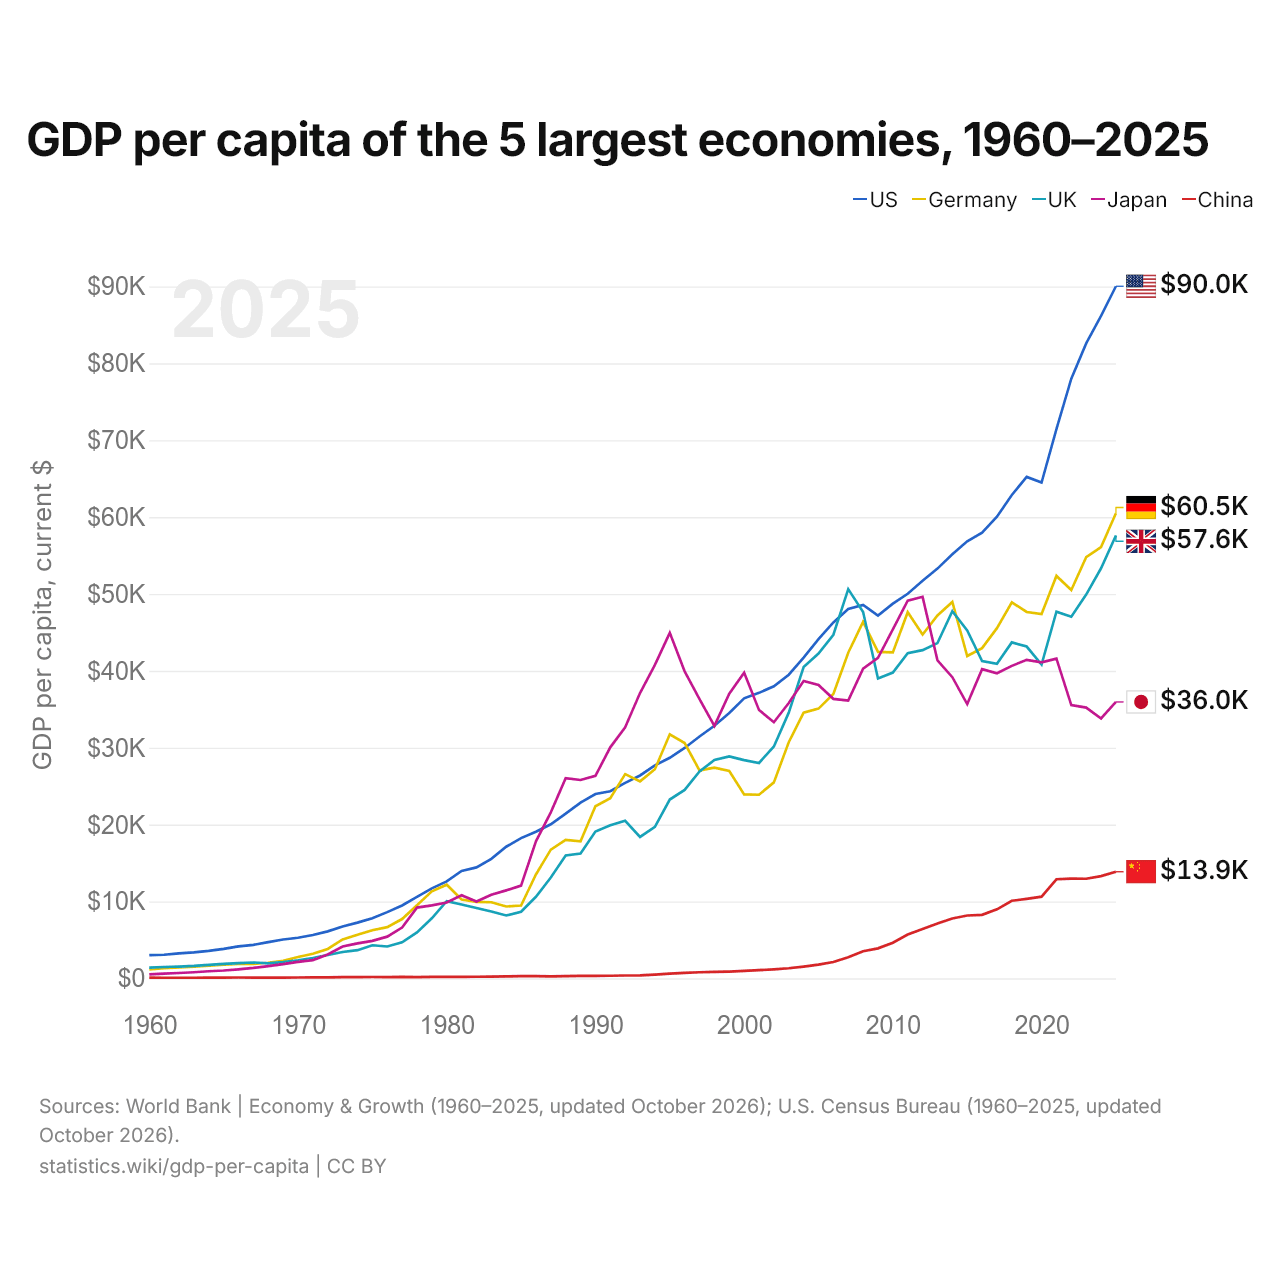
GDP per capita of the 5 largest economies, 1960–2025
| Year | GDP per capita, current $ | ||||
|---|---|---|---|---|---|
| United States | Germany | United Kingdom | Japan | China | |
| 2025 | $90,027 | $60,496 | $57,602 | $35,951 | $13,862 |
| 2024 | $86,170 | $56,104 | $53,341 | $33,797 | $13,293 |
| 2023 | $82,587 | $54,777 | $49,920 | $35,215 | $12,951 |
| 2022 | $78,009 | $50,507 | $47,035 | $35,548 | $12,971 |
| 2021 | $71,441 | $52,349 | $47,696 | $41,581 | $12,887 |
| 2020 | $64,490 | $47,395 | $40,815 | $41,099 | $10,627 |
| 2019 | $65,228 | $47,656 | $43,161 | $41,425 | $10,343 |
| 2018 | $62,876 | $48,916 | $43,704 | $40,645 | $10,086 |
| 2017 | $60,048 | $45,554 | $40,918 | $39,680 | $8,980 |
| 2016 | $57,977 | $42,949 | $41,259 | $40,215 | $8,255 |
| 2015 | $56,849 | $41,930 | $45,256 | $35,665 | $8,175 |
| 2014 | $55,153 | $48,960 | $47,747 | $39,173 | $7,781 |
| 2013 | $53,297 | $47,207 | $43,608 | $41,369 | $7,147 |
| 2012 | $51,708 | $44,718 | $42,688 | $49,627 | $6,405 |
| 2011 | $50,025 | $47,631 | $42,296 | $49,122 | $5,704 |
| 2010 | $48,742 | $42,397 | $39,778 | $45,378 | $4,629 |
| 2009 | $47,195 | $42,472 | $39,009 | $41,678 | $3,898 |
| 2008 | $48,570 | $46,379 | $47,652 | $40,294 | $3,523 |
| 2007 | $48,050 | $42,351 | $50,629 | $36,130 | $2,735 |
| 2006 | $46,302 | $36,980 | $44,695 | $36,354 | $2,129 |
| 2005 | $44,123 | $35,084 | $42,240 | $38,159 | $1,778 |
| 2004 | $41,725 | $34,567 | $40,504 | $38,678 | $1,531 |
| 2003 | $39,490 | $30,711 | $34,557 | $35,809 | $1,307 |
| 2002 | $37,998 | $25,487 | $30,159 | $33,316 | $1,164 |
| 2001 | $37,134 | $23,878 | $28,014 | $34,910 | $1,065 |
| 2000 | $36,426 | $23,926 | $28,384 | $39,753 | $969 |
| 1999 | $34,515 | $26,965 | $28,858 | $37,029 | $881 |
| 1998 | $32,854 | $27,396 | $28,396 | $32,835 | $835 |
| 1997 | $31,460 | $27,047 | $26,910 | $36,331 | $787 |
| 1996 | $29,968 | $30,600 | $24,503 | $39,930 | $713 |
| 1995 | $28,691 | $31,747 | $23,253 | $44,947 | $613 |
| 1994 | $27,695 | $27,202 | $19,709 | $40,774 | $476 |
| 1993 | $26,387 | $25,617 | $18,389 | $37,111 | $379 |
| 1992 | $25,419 | $26,560 | $20,487 | $32,667 | $368 |
| 1991 | $24,342 | $23,443 | $19,901 | $30,048 | $334 |
| 1990 | $23,976 | $22,386 | $19,095 | $26,345 | $319 |
| 1989 | $22,857 | $17,829 | $16,239 | $25,798 | $311 |
| 1988 | $21,417 | $17,997 | $15,987 | $26,037 | $284 |
| 1987 | $20,039 | $16,739 | $13,119 | $21,587 | $252.3 |
| 1986 | $19,071 | $13,511 | $10,611 | $17,819 | $282.4 |
| 1985 | $18,237 | $9,464 | $8,652 | $12,058 | $295 |
| 1984 | $17,121 | $9,347 | $8,179 | $11,443 | $251.2 |
| 1983 | $15,544 | $9,900 | $8,692 | $10,876 | $225.9 |
| 1982 | $14,434 | $9,950 | $9,146 | $9,986 | $203.7 |
| 1981 | $13,976 | $10,246 | $9,599 | $10,806 | $197.4 |
| 1980 | $12,612 | $12,183 | $10,032 | $9,872 | $195.1 |
| 1979 | $11,700 | $11,322 | $7,805 | $9,497 | $184.3 |
| 1978 | $10,588 | $9,517 | $5,977 | $9,202 | $156.7 |
| 1977 | $9,473 | $7,711 | $4,681 | $6,609 | $185.7 |
| 1976 | $8,611 | $6,659 | $4,138 | $5,422 | $165.7 |
| 1975 | $7,820 | $6,259 | $4,300 | $4,876 | $178.6 |
| 1974 | $7,243 | $5,660 | $3,666 | $4,542 | $160.4 |
| 1973 | $6,744 | $5,065 | $3,426 | $4,147 | $157.3 |
| 1972 | $6,112 | $3,824 | $3,030 | $3,095 | $132.1 |
| 1971 | $5,632 | $3,204 | $2,650 | $2,370 | $118.8 |
| 1970 | $5,282 | $2,771 | $2,348 | $2,145 | $113.3 |
| 1969 | $5,052 | $2,281 | $2,101 | $1,841 | $100.3 |
| 1968 | $4,715 | $2,025 | $1,952 | $1,586 | $91.6 |
| 1967 | $4,353 | $1,886 | $2,059 | $1,354 | $96.8 |
| 1966 | $4,157 | $1,871 | $1,987 | $1,168 | $104.5 |
| 1965 | $3,834 | $1,774 | $1,874 | $1,015 | $98.7 |
| 1964 | $3,579 | $1,637 | $1,748 | $922 | $85.7 |
| 1963 | $3,380 | $1,502 | $1,613 | $792 | $74.5 |
| 1962 | $3,249 | $1,431 | $1,526 | $699 | $71.1 |
| 1961 | $3,071 | $1,316 | $1,472 | $622 | $76 |
| 1960 | $3,022 | $1,162 | $1,398 | $519 | $89.7 |
In 2025, GDP per capita was $90,027 in the United States, $60,496 in Germany, $57,602 in the United Kingdom, $35,951 in Japan and $13,862 in China. The United States' GDP per capita has been the highest of the five since 2008. The most recent change in their order came in 2021, when the United Kingdom passed Japan.
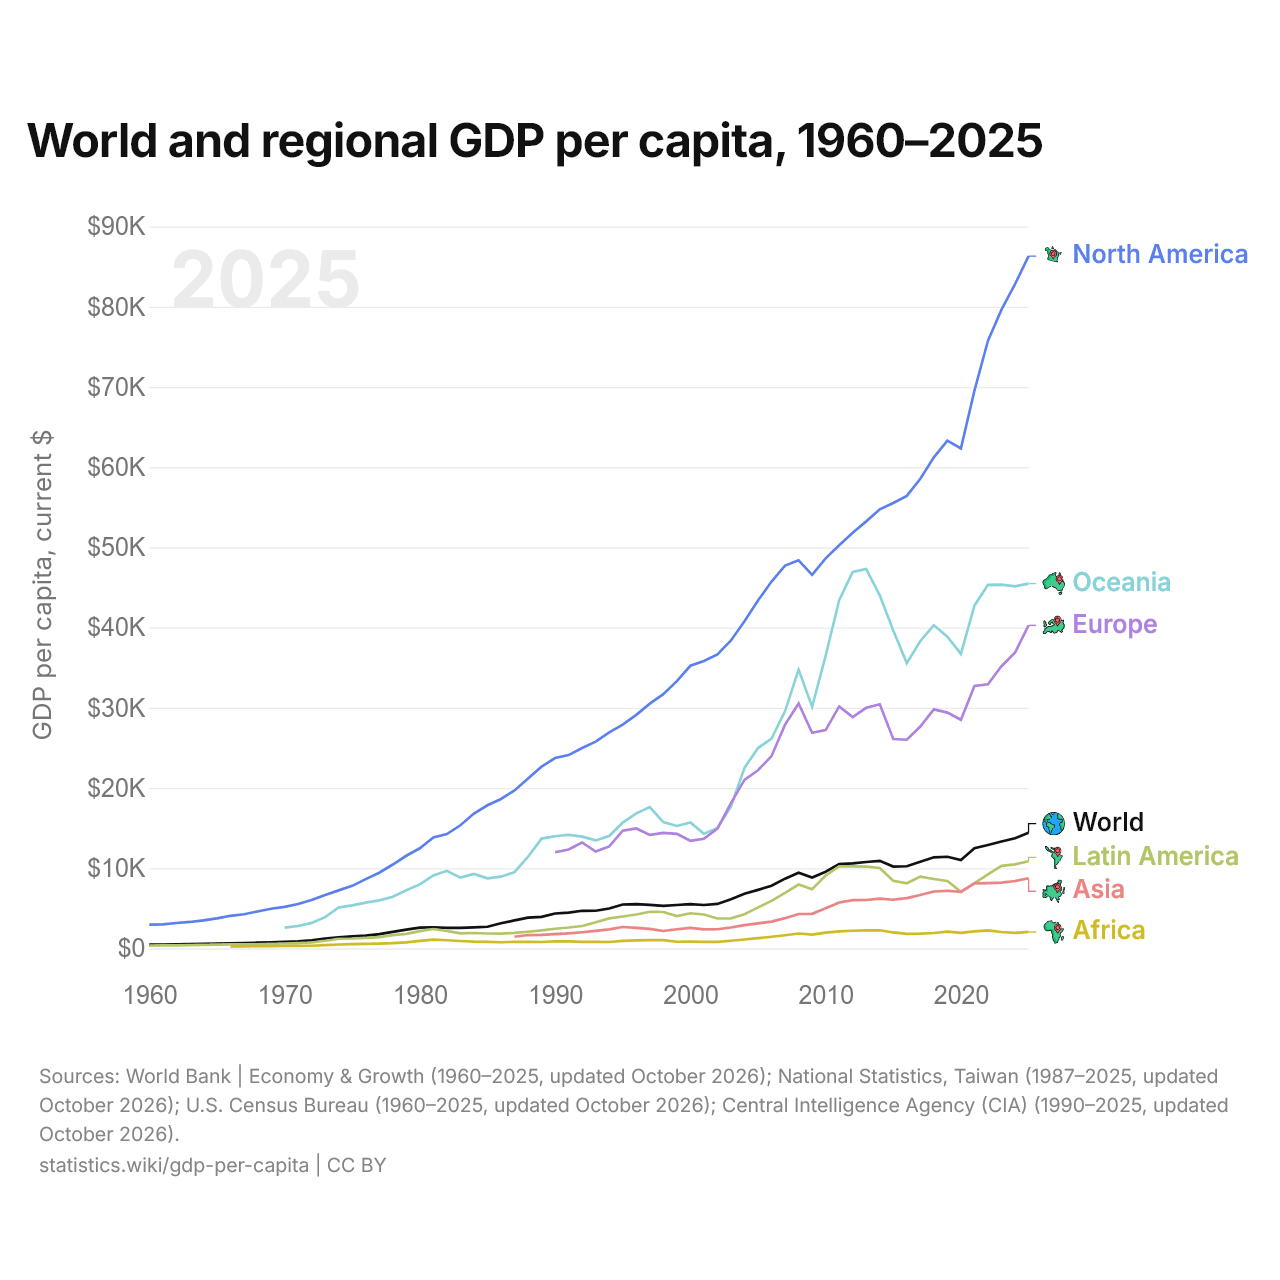
World and regional GDP per capita, 1960–2025
| Year | GDP per capita, current $ | ||||||
|---|---|---|---|---|---|---|---|
| World | North America | Oceania | Europe | Latin America | Asia | Africa | |
| 2025 | $14,406 | $86,297 | $45,477 | $40,260 | $10,849 | $8,741 | $2,043 |
| 2024 | $13,717 | $82,798 | $45,132 | $36,875 | $10,471 | $8,397 | $1,928 |
| 2023 | $13,314 | $79,638 | $45,342 | $35,175 | $10,287 | $8,184 | $2,035 |
| 2022 | $12,876 | $75,762 | $45,317 | $32,914 | $9,219 | $8,137 | $2,231 |
| 2021 | $12,473 | $69,525 | $42,720 | $32,721 | $8,131 | $8,108 | $2,115 |
| 2020 | $10,999 | $62,334 | $36,715 | $28,493 | $7,033 | $7,044 | $1,938 |
| 2019 | $11,418 | $63,298 | $38,859 | $29,389 | $8,405 | $7,181 | $2,087 |
| 2018 | $11,345 | $61,219 | $40,285 | $29,796 | $8,651 | $7,089 | $1,915 |
| 2017 | $10,784 | $58,546 | $38,312 | $27,657 | $8,937 | $6,647 | $1,835 |
| 2016 | $10,239 | $56,408 | $35,557 | $26,010 | $8,107 | $6,263 | $1,811 |
| 2015 | $10,192 | $55,526 | $39,629 | $26,090 | $8,415 | $6,056 | $1,980 |
| 2014 | $10,912 | $54,735 | $44,007 | $30,437 | $10,026 | $6,194 | $2,254 |
| 2013 | $10,759 | $53,232 | $47,297 | $29,993 | $10,186 | $6,024 | $2,234 |
| 2012 | $10,598 | $51,804 | $46,933 | $28,827 | $10,210 | $6,011 | $2,193 |
| 2011 | $10,497 | $50,243 | $43,396 | $30,166 | $10,217 | $5,724 | $2,106 |
| 2010 | $9,555 | $48,625 | $36,468 | $27,210 | $9,062 | $5,001 | $1,953 |
| 2009 | $8,827 | $46,571 | $30,117 | $26,867 | $7,364 | $4,304 | $1,714 |
| 2008 | $9,426 | $48,387 | $34,746 | $30,534 | $7,954 | $4,277 | $1,849 |
| 2007 | $8,685 | $47,717 | $29,579 | $27,880 | $6,910 | $3,762 | $1,631 |
| 2006 | $7,803 | $45,731 | $26,146 | $23,967 | $5,919 | $3,331 | $1,444 |
| 2005 | $7,291 | $43,362 | $24,967 | $22,206 | $5,102 | $3,115 | $1,263 |
| 2004 | $6,818 | $40,783 | $22,485 | $21,002 | $4,259 | $2,893 | $1,103 |
| 2003 | $6,130 | $38,390 | $17,701 | $18,102 | $3,742 | $2,598 | $940 |
| 2002 | $5,539 | $36,647 | $14,972 | $14,928 | $3,723 | $2,376 | $800 |
| 2001 | $5,404 | $35,827 | $14,282 | $13,657 | $4,216 | $2,358 | $797 |
| 2000 | $5,513 | $35,231 | $15,690 | $13,413 | $4,375 | $2,555 | $840 |
| 1999 | $5,401 | $33,317 | $15,255 | $14,268 | $4,018 | $2,375 | $816 |
| 1998 | $5,302 | $31,688 | $15,735 | $14,390 | $4,534 | $2,161 | $1,020 |
| 1997 | $5,409 | $30,515 | $17,603 | $14,145 | $4,560 | $2,419 | $1,029 |
| 1996 | $5,507 | $29,109 | $16,827 | $14,948 | $4,223 | $2,555 | $1,002 |
| 1995 | $5,463 | $27,897 | $15,678 | $14,666 | $3,968 | $2,662 | $924 |
| 1994 | $4,967 | $26,931 | $13,995 | $12,708 | $3,730 | $2,370 | $790 |
| 1993 | $4,685 | $25,771 | $13,457 | $12,072 | $3,242 | $2,172 | $797 |
| 1992 | $4,680 | $24,974 | $13,926 | $13,199 | $2,782 | $2,005 | $812 |
| 1991 | $4,454 | $24,093 | $14,163 | $12,321 | $2,592 | $1,874 | $876 |
| 1990 | $4,339 | $23,731 | $13,972 | $11,978 | $2,444 | $1,781 | $882 |
| 1989 | $3,931 | $22,652 | $13,683 | - | $2,248 | $1,676 | $788 |
| 1988 | $3,830 | $21,180 | $11,419 | - | $2,073 | $1,657 | $795 |
| 1987 | $3,488 | $19,679 | $9,493 | - | $1,927 | $1,441 | $809 |
| 1986 | $3,119 | $18,625 | $8,934 | - | $1,833 | - | $762 |
| 1985 | $2,691 | $17,838 | $8,720 | - | $1,850 | - | $805 |
| 1984 | $2,614 | $16,809 | $9,270 | - | $1,914 | - | $831 |
| 1983 | $2,561 | $15,342 | $8,811 | - | $1,860 | - | $916 |
| 1982 | $2,554 | $14,247 | $9,664 | - | $2,160 | - | $1,007 |
| 1981 | $2,629 | $13,820 | $9,091 | - | $2,405 | - | $1,087 |
| 1980 | $2,587 | $12,475 | $7,969 | - | $2,151 | - | $921 |
| 1979 | $2,335 | $11,542 | $7,247 | - | $1,806 | - | $751 |
| 1978 | $2,055 | $10,449 | $6,442 | - | $1,647 | - | $645 |
| 1977 | $1,766 | $9,422 | $5,975 | - | $1,406 | - | $595 |
| 1976 | $1,590 | $8,633 | $5,703 | - | $1,310 | - | $551 |
| 1975 | $1,489 | $7,792 | $5,359 | - | $1,223 | - | $515 |
| 1974 | $1,362 | $7,225 | $5,089 | - | $1,194 | - | $481 |
| 1973 | $1,202 | $6,659 | $3,892 | - | $941 | - | $392 |
| 1972 | $1,002 | $6,015 | $3,172 | - | $722 | - | $327 |
| 1971 | $885 | $5,527 | $2,786 | - | $657 | - | $298.6 |
| 1970 | $818 | $5,173 | $2,582 | - | $604 | - | $295.5 |
| 1969 | $761 | $4,932 | - | - | $564 | - | $275.4 |
| 1968 | $703 | $4,598 | - | - | $513 | - | $256.9 |
| 1967 | $664 | $4,248 | - | - | $485 | - | $246.1 |
| 1966 | $639 | $4,055 | - | - | $487 | - | $247.2 |
| 1965 | $602 | $3,736 | - | - | $455 | - | - |
| 1964 | $564 | $3,486 | - | - | $433 | - | - |
| 1963 | $525 | $3,289 | - | - | $400 | - | - |
| 1962 | $496 | $3,161 | - | - | $378 | - | - |
| 1961 | $472 | $2,996 | - | - | $370 | - | - |
| 1960 | $453 | $2,954 | - | - | $344 | - | - |
In 2025, GDP per capita was highest in North America, at $86,297, and lowest in Africa, at $2,043. The world's GDP per capita rose from $4,339 in 1990 to $14,406.
Compare the GDP per capita of any 2 countries
Sources:
- World Bank | Economy & Growth (1960–2025, updated October 2026)
- National Statistics, Taiwan (1985–2025, updated October 2026)
- Central Intelligence Agency (CIA) (1990–2026, updated October 2026)
- U.S. Census Bureau (1960–2025, updated October 2026)
Creative Commons Attribution (CC BY): you may copy, share, adapt and reuse this content, also commercially, as long as you credit statistics.wiki and note any changes you made. The sources listed above may have their own license terms.