
El Salvador GDP per capita, 1965–2025
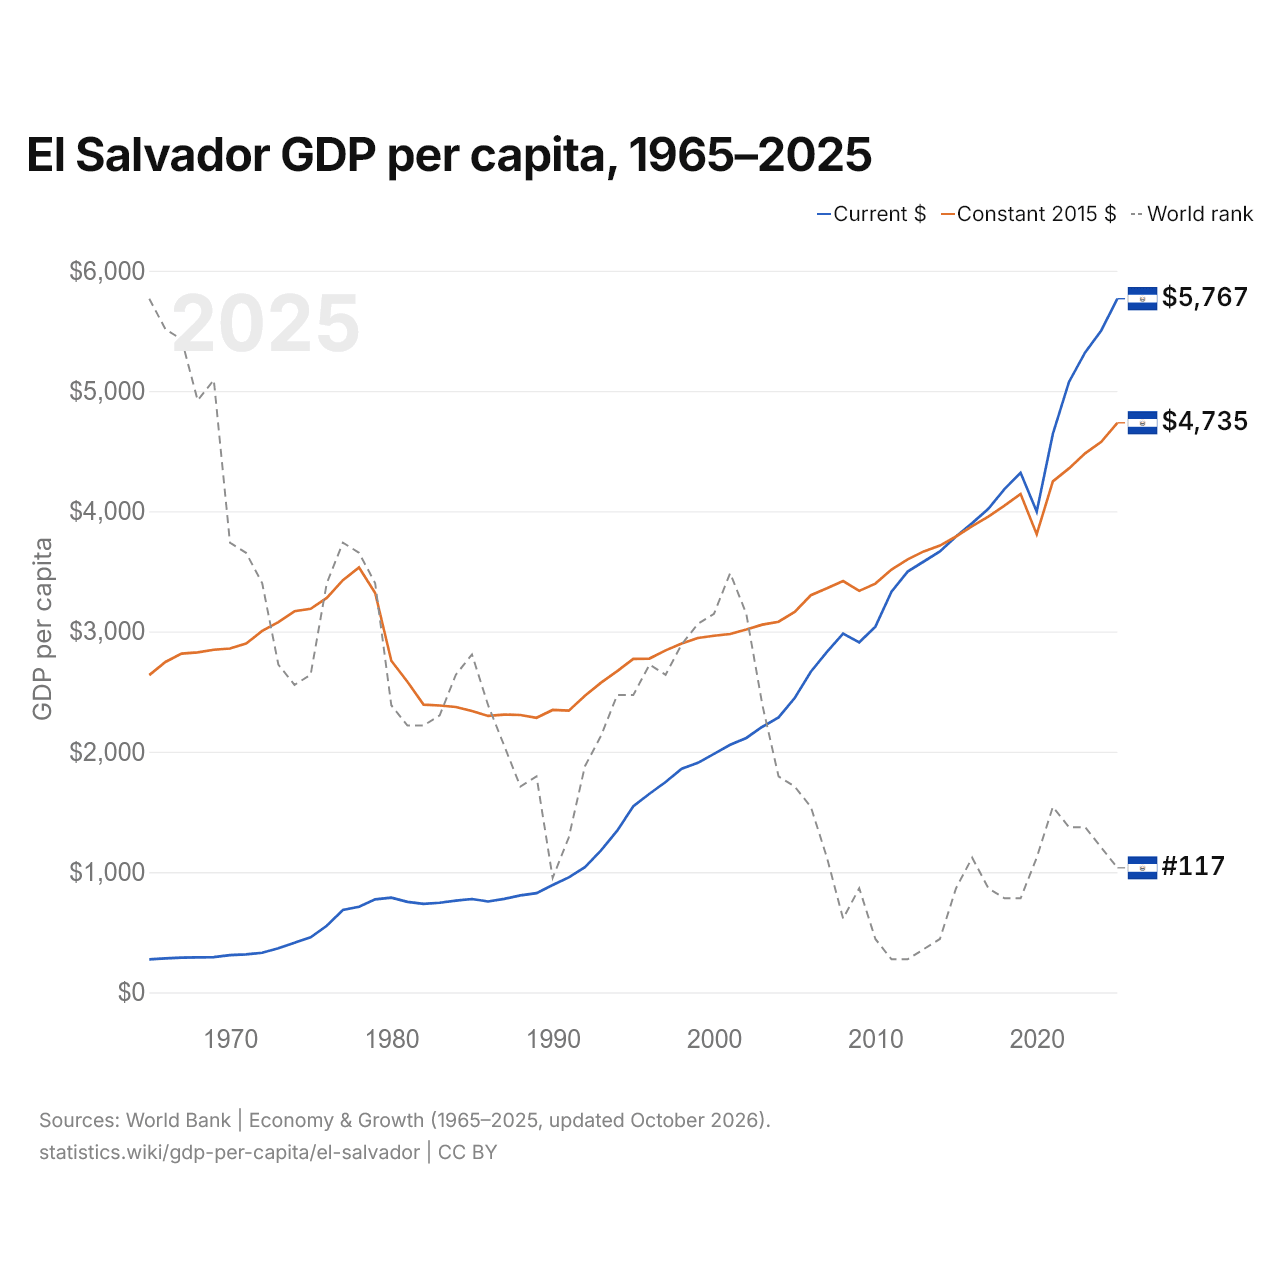
| Year | GDP per capita | World rank | |
|---|---|---|---|
| Current $ | Constant 2015 $ | ||
| 2025 | $5,767 | $4,735 | #117 |
| 2024 | $5,503 | $4,577 | #115 |
| 2023 | $5,320 | $4,481 | #113 |
| 2022 | $5,075 | $4,356 | #113 |
| 2021 | $4,643 | $4,248 | #111 |
| 2020 | $3,997 | $3,809 | #116 |
| 2019 | $4,320 | $4,143 | #120 |
| 2018 | $4,184 | $4,046 | #120 |
| 2017 | $4,020 | $3,955 | #119 |
| 2016 | $3,901 | $3,876 | #116 |
| 2015 | $3,790 | $3,790 | #119 |
| 2014 | $3,666 | $3,714 | #124 |
| 2013 | $3,582 | $3,666 | #125 |
| 2012 | $3,498 | $3,600 | #126 |
| 2011 | $3,331 | $3,515 | #126 |
| 2010 | $3,040 | $3,398 | #124 |
| 2009 | $2,910 | $3,338 | #119 |
| 2008 | $2,983 | $3,420 | #122 |
| 2007 | $2,831 | $3,359 | #116 |
| 2006 | $2,666 | $3,302 | #111 |
| 2005 | $2,447 | $3,163 | #109 |
| 2004 | $2,286 | $3,081 | #108 |
| 2003 | $2,208 | $3,057 | #101 |
| 2002 | $2,115 | $3,016 | #92 |
| 2001 | $2,058 | $2,979 | #88 |
| 2000 | $1,983 | $2,965 | #92 |
| 1999 | $1,908 | $2,946 | #93 |
| 1998 | $1,860 | $2,900 | #95 |
| 1997 | $1,749 | $2,843 | #98 |
| 1996 | $1,651 | $2,775 | #97 |
| 1995 | $1,548 | $2,773 | #100 |
| 1994 | $1,344 | $2,670 | #100 |
| 1993 | $1,180 | $2,575 | #104 |
| 1992 | $1,041 | $2,466 | #107 |
| 1991 | $956 | $2,342 | #114 |
| 1990 | $892 | $2,348 | #118 |
| 1989 | $825 | $2,283 | #108 |
| 1988 | $806 | $2,306 | #109 |
| 1987 | $777 | $2,309 | #105 |
| 1986 | $755 | $2,298 | #101 |
| 1985 | $776 | $2,339 | #96 |
| 1984 | $763 | $2,372 | #98 |
| 1983 | $745 | $2,385 | #102 |
| 1982 | $735 | $2,392 | #103 |
| 1981 | $752 | $2,582 | #103 |
| 1980 | $787 | $2,757 | #101 |
| 1979 | $773 | $3,320 | #89 |
| 1978 | $712 | $3,533 | #86 |
| 1977 | $684 | $3,427 | #85 |
| 1976 | $553 | $3,279 | #89 |
| 1975 | $457 | $3,189 | #98 |
| 1974 | $413 | $3,168 | #99 |
| 1973 | $366 | $3,078 | #97 |
| 1972 | $329 | $3,005 | #89 |
| 1971 | $316 | $2,899 | #86 |
| 1970 | $309 | $2,859 | #85 |
| 1969 | $293.4 | $2,848 | #69 |
| 1968 | $290.1 | $2,827 | #71 |
| 1967 | $288.4 | $2,816 | #65 |
| 1966 | $282.4 | $2,747 | #64 |
| 1965 | $274.3 | $2,637 | #61 |
In 2025, El Salvador's GDP per capita was $5,767, up from $274 in 1965. El Salvador's was 40% of the world's GDP per capita of $14,406. It was the 117th highest in the world, down from 115th in 2024. Its highest rank was 61st, last held in 1965. In constant 2015 dollars, GDP per capita grew 3.5% in 2025 and 24.9% over the ten years since 2015.
In constant 2015 dollars, El Salvador's GDP per capita was 1.8 times as large in 2025 as in 1965, an average growth of 1.0% a year. Of the decades since 1970, El Salvador's GDP per capita grew fastest from 1990 to 2000, at 2.4% a year, and slowest from 1980 to 1990, when it fell 1.6% a year.
El Salvador's GDP per capita was the 30th highest of the 35 countries of Latin America, where it ranged from Haiti's $2,694 to the Cayman Islands' $104,293 (2024). El Salvador's GDP per capita (PPP) was $14,101 in 2025, the 120th highest in the world.
El Salvador in the world GDP per capita ranking, 2025







Compare El Salvador GDP per capita with other countries
Sources:
- World Bank | Economy & Growth (1965–2025, updated October 2026)
Creative Commons Attribution (CC BY): you may copy, share, adapt and reuse this content, also commercially, as long as you credit statistics.wiki and note any changes you made. The sources listed above may have their own license terms.