
List of countries by income inequality (latest survey)
| Rank | Country | Richest 10% ÷ poorest 10% | Income share of the richest 10% | Income share of the poorest 10% | Survey year |
|---|---|---|---|---|---|
| 1 |  Namibia |
47× | 47.2% | 1.0% | 2015 |
| 2 |  Colombia |
43× | 42.7% | 1.0% | 2024 |
| 3 |  Panama |
31× | 37.6% | 1.2% | 2024 |
| 4 |  Guyana |
31× | 34.4% | 1.1% | 1998 |
| 5 |  Botswana |
31× | 42.9% | 1.4% | 2015 |
| 6 |  Eswatini |
31× | 42.7% | 1.4% | 2016 |
| 7 |  Angola |
30× | 39.6% | 1.3% | 2018 |
| 8 |  Brazil |
30× | 39.3% | 1.3% | 2024 |
| 9 |  South Africa |
30× | 42.1% | 1.4% | 2022 |
| 10 |  Venezuela |
28× | 33.2% | 1.2% | 2006 |
| 11 |  Honduras |
27× | 32.3% | 1.2% | 2024 |
| 12 |  Zambia |
26× | 39.1% | 1.5% | 2022 |
| 13 |  Mozambique |
24× | 40.8% | 1.7% | 2022 |
| 14 |  Congo |
24× | 37.9% | 1.6% | 2011 |
| 15 |  Zimbabwe |
21× | 40.5% | 1.9% | 2019 |
| 16 |  Guatemala |
21× | 34.1% | 1.6% | 2023 |
| 17 |  Ecuador |
21× | 35.1% | 1.7% | 2025 |
| 18 |  Ghana |
20× | 32.2% | 1.6% | 2016 |
| 19 |  Lesotho |
19× | 32.9% | 1.7% | 2017 |
| 20 |  Costa Rica |
19× | 34.3% | 1.8% | 2025 |
| 21 |  Nicaragua |
19× | 37.2% | 2.0% | 2014 |
| 22 |  South Sudan |
18× | 33.0% | 1.8% | 2016 |
| 23 |  United States |
18× | 30.7% | 1.7% | 2024 |
| 24 |  Paraguay |
18× | 35.0% | 2.0% | 2024 |
| 25 |  DR Congo |
17× | 35.7% | 2.1% | 2020 |
| 26 |  Djibouti |
17× | 32.3% | 1.9% | 2017 |
| 27 |  Argentina |
16× | 31.2% | 1.9% | 2024 |
| 28 |  Turkey |
16× | 34.4% | 2.1% | 2023 |
| 29 |  Papua New Guinea |
16× | 31.0% | 1.9% | 2009 |
| 30 |  Saint Lucia |
16× | 34.1% | 2.1% | 2015 |
| 31 |  Bolivia |
16× | 30.6% | 1.9% | 2024 |
| 32 |  Grenada |
16× | 33.7% | 2.1% | 2018 |
| 33 |  Mexico |
16× | 33.4% | 2.1% | 2024 |
| 34 |  CAR |
16× | 33.1% | 2.1% | 2021 |
| 35 |  El Salvador |
16× | 29.7% | 1.9% | 2023 |
| 36 |  Peru |
15× | 30.3% | 2.0% | 2024 |
| 37 |  Israel |
15× | 27.0% | 1.8% | 2022 |
| 38 |  Chile |
15× | 34.3% | 2.3% | 2024 |
| 39 |  Haiti |
15× | 31.2% | 2.1% | 2012 |
| 40 |  Bulgaria |
15× | 31.1% | 2.1% | 2023 |
| 40 |  Cameroon |
15× | 31.1% | 2.1% | 2021 |
| 42 |  Cape Verde |
15× | 32.3% | 2.2% | 2015 |
| 43 |  Trinidad |
14× | 29.9% | 2.1% | 1992 |
| 44 |  Suriname |
14× | 30.1% | 2.2% | 2022 |
| 45 |  Belize |
14× | 30.0% | 2.2% | 2018 |
| 45 |  Uruguay |
14× | 30.0% | 2.2% | 2024 |
| 47 |  Jamaica |
13× | 29.6% | 2.2% | 2021 |
| 48 |  Malaysia |
13× | 30.9% | 2.3% | 2021 |
| 49 |  Turkmenistan |
13× | 31.5% | 2.4% | 1998 |
| 50 |  Dominican Republic |
13× | 29.5% | 2.3% | 2024 |
| 51 |  Sao Tome |
13× | 32.8% | 2.6% | 2017 |
| 52 |  Gabon |
13× | 27.7% | 2.2% | 2017 |
| 53 |  Lithuania |
12× | 27.3% | 2.2% | 2023 |
| 54 |  North Macedonia |
12× | 22.9% | 1.9% | 2019 |
| 55 |  Morocco |
12× | 31.9% | 2.7% | 2013 |
| 56 |  Montenegro |
12× | 24.7% | 2.1% | 2021 |
| 57 |  Gambia |
12× | 30.5% | 2.6% | 2020 |
| 58 |  Samoa |
12× | 31.3% | 2.7% | 2013 |
| 59 |  Tanzania |
11× | 33.1% | 2.9% | 2018 |
| 60 |  Tuvalu |
11× | 30.8% | 2.7% | 2010 |
| 61 |  Germany |
11× | 26.2% | 2.3% | 2022 |
| 62 |  Uganda |
11× | 29.3% | 2.6% | 2023 |
| 63 |  Italy |
11× | 25.8% | 2.3% | 2023 |
| 64 |  Equatorial Guinea |
11× | 29.1% | 2.6% | 2022 |
| 65 |  Spain |
11× | 24.5% | 2.2% | 2023 |
| 66 |  Philippines |
11× | 31.6% | 2.9% | 2023 |
| 67 |  Palestine |
11× | 27.1% | 2.5% | 2023 |
| 68 |  Vietnam |
11× | 28.1% | 2.6% | 2022 |
| 69 |  Rwanda |
11× | 33.4% | 3.1% | 2023 |
| 70 |  Malawi |
11× | 31.0% | 2.9% | 2019 |
| 71 |  Kenya |
11× | 30.9% | 2.9% | 2022 |
| 72 |  Togo |
11× | 29.6% | 2.8% | 2021 |
| 73 |  Japan |
11× | 24.3% | 2.3% | 2020 |
| 74 |  Chad |
11× | 29.5% | 2.8% | 2022 |
| 75 |  Solomon Islands |
10× | 29.2% | 2.8% | 2012 |
| 76 |  Barbados |
10× | 25.8% | 2.5% | 2016 |
| 77 |  Burundi |
10× | 29.9% | 2.9% | 2020 |
| 77 |  Mauritius |
10× | 29.9% | 2.9% | 2017 |
| 79 |  Madagascar |
10× | 29.6% | 2.9% | 2021 |
| 80 |  Uzbekistan |
10× | 24.2% | 2.4% | 2025 |
| 81 |  Latvia |
10× | 26.2% | 2.6% | 2023 |
| 82 |  Iran |
10× | 28.2% | 2.8% | 2023 |
| 83 |  Burkina Faso |
10× | 30.2% | 3.0% | 2021 |
| 84 |  Portugal |
10.0× | 26.9% | 2.7% | 2023 |
| 85 |  Australia |
10.0× | 25.9% | 2.6% | 2020 |
| 86 |  Sri Lanka |
9.9× | 30.8% | 3.1% | 2019 |
| 87 |  Qatar |
9.9× | 25.8% | 2.6% | 2017 |
| 88 |  Serbia |
9.9× | 24.7% | 2.5% | 2023 |
| 89 |  Marshall Islands |
9.8× | 27.5% | 2.8% | 2019 |
| 90 |  Yemen |
9.8× | 29.4% | 3.0% | 2014 |
| 91 |  Tajikistan |
9.7× | 28.2% | 2.9% | 2024 |
| 92 |  Greece |
9.6× | 26.0% | 2.7% | 2023 |
| 93 |  Senegal |
9.6× | 28.8% | 3.0% | 2021 |
| 94 |  Liberia |
9.3× | 27.1% | 2.9% | 2016 |
| 95 |  Seychelles |
9.2× | 23.9% | 2.6% | 2018 |
| 96 |  China |
9.2× | 28.4% | 3.1% | 2022 |
| 97 |  Lebanon |
9.1× | 25.6% | 2.8% | 2022 |
| 98 |  Romania |
9.1× | 21.8% | 2.4% | 2023 |
| 99 |  Georgia |
9.0× | 26.2% | 2.9% | 2024 |
| 100 |  Ivory Coast |
9.0× | 27.8% | 3.1% | 2021 |
| 101 |  Luxembourg |
8.9× | 25.0% | 2.8% | 2023 |
| 102 |  Austria |
8.9× | 24.8% | 2.8% | 2023 |
| 103 |  Mali |
8.8× | 28.3% | 3.2% | 2021 |
| 104 |  Malta |
8.8× | 24.7% | 2.8% | 2023 |
| 105 |  Benin |
8.8× | 27.2% | 3.1% | 2021 |
| 106 |  Nigeria |
8.8× | 26.3% | 3.0% | 2022 |
| 106 |  Switzerland |
8.8× | 26.3% | 3.0% | 2023 |
| 108 |  Hungary |
8.7× | 24.4% | 2.8% | 2022 |
| 109 |  Tunisia |
8.7× | 27.0% | 3.1% | 2021 |
| 110 |  Sudan |
8.7× | 27.8% | 3.2% | 2014 |
| 111 |  Sierra Leone |
8.6× | 29.4% | 3.4% | 2018 |
| 112 |  Laos |
8.6× | 28.5% | 3.3% | 2024 |
| 113 |  South Korea |
8.6× | 25.0% | 2.9% | 2021 |
| 113 |  United Kingdom |
8.6× | 25.0% | 2.9% | 2021 |
| 115 |  Canada |
8.5× | 24.6% | 2.9% | 2022 |
| 116 |  France |
8.3× | 25.0% | 3.0% | 2023 |
| 117 |  Vanuatu |
8.2× | 24.7% | 3.0% | 2019 |
| 118 |  Indonesia |
8.2× | 28.7% | 3.5% | 2025 |
| 119 |  Pakistan |
8.1× | 27.7% | 3.4% | 2024 |
| 120 |  Russia |
8.1× | 25.1% | 3.1% | 2023 |
| 121 |  Croatia |
8.0× | 23.3% | 2.9% | 2023 |
| 122 |  Sweden |
8.0× | 22.3% | 2.8% | 2023 |
| 123 |  Mauritania |
7.9× | 24.6% | 3.1% | 2019 |
| 124 |  Jordan |
7.8× | 27.4% | 3.5% | 2010 |
| 125 |  Guinea-Bissau |
7.7× | 26.1% | 3.4% | 2021 |
| 126 |  Thailand |
7.6× | 26.0% | 3.4% | 2024 |
| 127 |  Estonia |
7.6× | 23.7% | 3.1% | 2023 |
| 128 |  Nauru |
7.4× | 25.3% | 3.4% | 2012 |
| 129 |  UAE |
7.3× | 20.5% | 2.8% | 2018 |
| 130 |  Niger |
7.3× | 27.8% | 3.8% | 2021 |
| 131 |  Cyprus |
7.3× | 26.3% | 3.6% | 2023 |
| 132 |  Mongolia |
7.2× | 24.6% | 3.4% | 2022 |
| 133 |  Bosnia |
7.2× | 23.6% | 3.3% | 2021 |
| 134 |  Ethiopia |
7.1× | 24.8% | 3.5% | 2021 |
| 135 |  Denmark |
7.1× | 25.5% | 3.6% | 2023 |
| 136 |  Poland |
6.9× | 22.9% | 3.3% | 2023 |
| 137 |  Fiji |
6.9× | 24.2% | 3.5% | 2019 |
| 138 |  Bangladesh |
6.9× | 25.5% | 3.7% | 2022 |
| 139 |  Myanmar |
6.7× | 25.5% | 3.8% | 2017 |
| 140 |  Albania |
6.7× | 22.8% | 3.4% | 2020 |
| 141 |  Comoros |
6.6× | 24.6% | 3.7% | 2024 |
| 142 |  Guinea |
6.6× | 23.1% | 3.5% | 2018 |
| 143 |  Iraq |
6.5× | 24.2% | 3.7% | 2023 |
| 143 |  Nepal |
6.5× | 24.2% | 3.7% | 2022 |
| 145 |  Ireland |
6.5× | 24.1% | 3.7% | 2023 |
| 146 |  Bhutan |
6.3× | 22.7% | 3.6% | 2022 |
| 147 |  Maldives |
6.1× | 23.3% | 3.8% | 2019 |
| 148 |  Finland |
6.1× | 22.5% | 3.7% | 2023 |
| 149 |  Iceland |
6.1× | 22.4% | 3.7% | 2019 |
| 150 |  East Timor |
6.0× | 24.0% | 4.0% | 2014 |
| 150 |  Norway |
6.0× | 21.6% | 3.6% | 2023 |
| 152 |  Belgium |
6.0× | 22.2% | 3.7% | 2023 |
| 153 |  Netherlands |
5.9× | 21.4% | 3.6% | 2021 |
| 154 |  Egypt |
5.9× | 24.6% | 4.2% | 2021 |
| 155 |  Armenia |
5.8× | 23.3% | 4.0% | 2024 |
| 156 |  Kazakhstan |
5.8× | 24.8% | 4.3% | 2021 |
| 157 |  Algeria |
5.7× | 22.9% | 4.0% | 2011 |
| 158 |  Slovakia |
5.7× | 18.8% | 3.3% | 2023 |
| 159 |  Czech Republic |
5.7× | 21.5% | 3.8% | 2023 |
| 160 |  Syria |
5.5× | 20.9% | 3.8% | 2022 |
| 160 |  Tonga |
5.5× | 22.0% | 4.0% | 2021 |
| 162 |  Kyrgyzstan |
5.5× | 22.9% | 4.2% | 2024 |
| 163 |  Moldova |
5.3× | 22.7% | 4.3% | 2024 |
| 164 |  Ukraine |
5.0× | 21.7% | 4.3% | 2020 |
| 165 |  Azerbaijan |
5.0× | 24.2% | 4.8% | 2005 |
| 166 |  Slovenia |
5.0× | 20.6% | 4.1% | 2023 |
| 167 |  Kiribati |
4.8× | 20.9% | 4.4% | 2023 |
| 168 |  Belarus |
4.6× | 20.7% | 4.5% | 2020 |
| 169 |  India |
4.2× | 20.5% | 4.9% | 2023 |
The list ranks 169 countries by how many times as much income the richest 10% of people received as the poorest 10% in each country's latest survey, from Namibia (47.2 times, 2015) to India (4.2 times). In half of the countries, the richest 10% receive less than 10.0 times as much as the poorest 10%.
The figures come from household surveys: the share of all income, or of consumption where a country's survey measures that instead, that goes to the richest tenth of the people and to the poorest tenth. One share divided by the other tells how many times as much the richest 10% receive as the poorest 10%: a measure of the two ends, not the Gini index, which sums up the whole distribution in one number. Countries take their surveys in different years, so each country's figures are from its latest survey.
Most unequal countries: richest 10% ÷ poorest 10%
Least unequal countries: richest 10% ÷ poorest 10%
Of the ten most unequal countries, five are in Africa; of the ten least unequal, four are in Asia.
Income inequality map: richest 10% ÷ poorest 10%
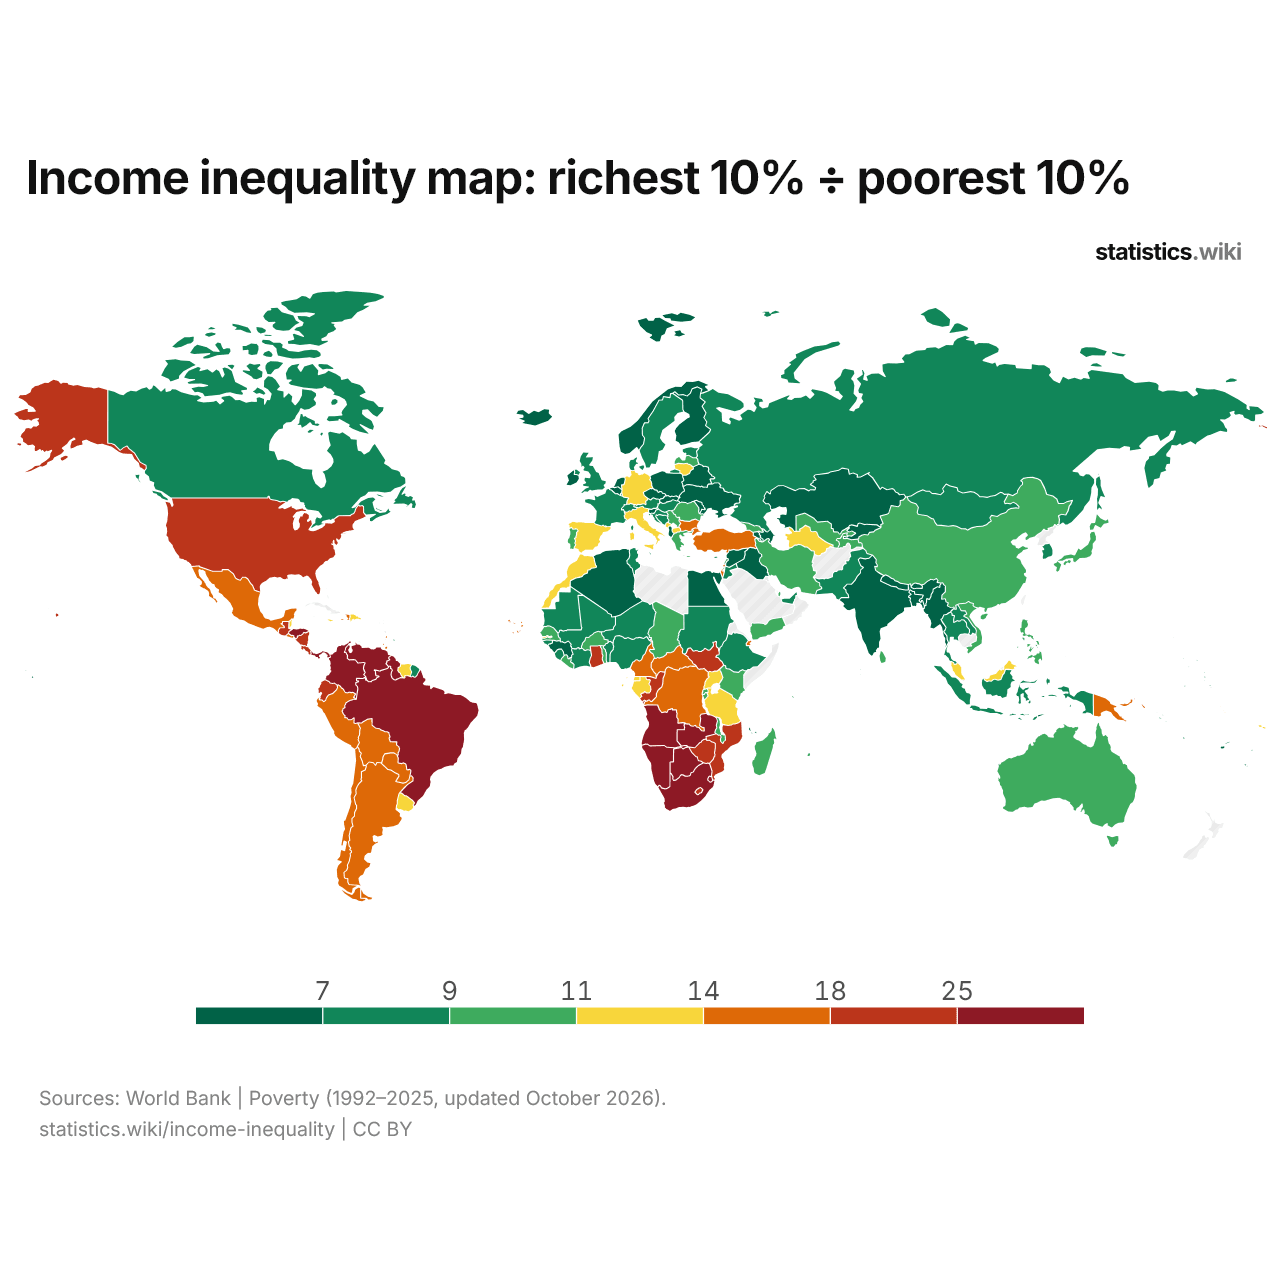
In the latest surveys, the richest 10% receive more than 18 times as much income as the poorest 10% in 23 countries and less than 7 times as much in 34.
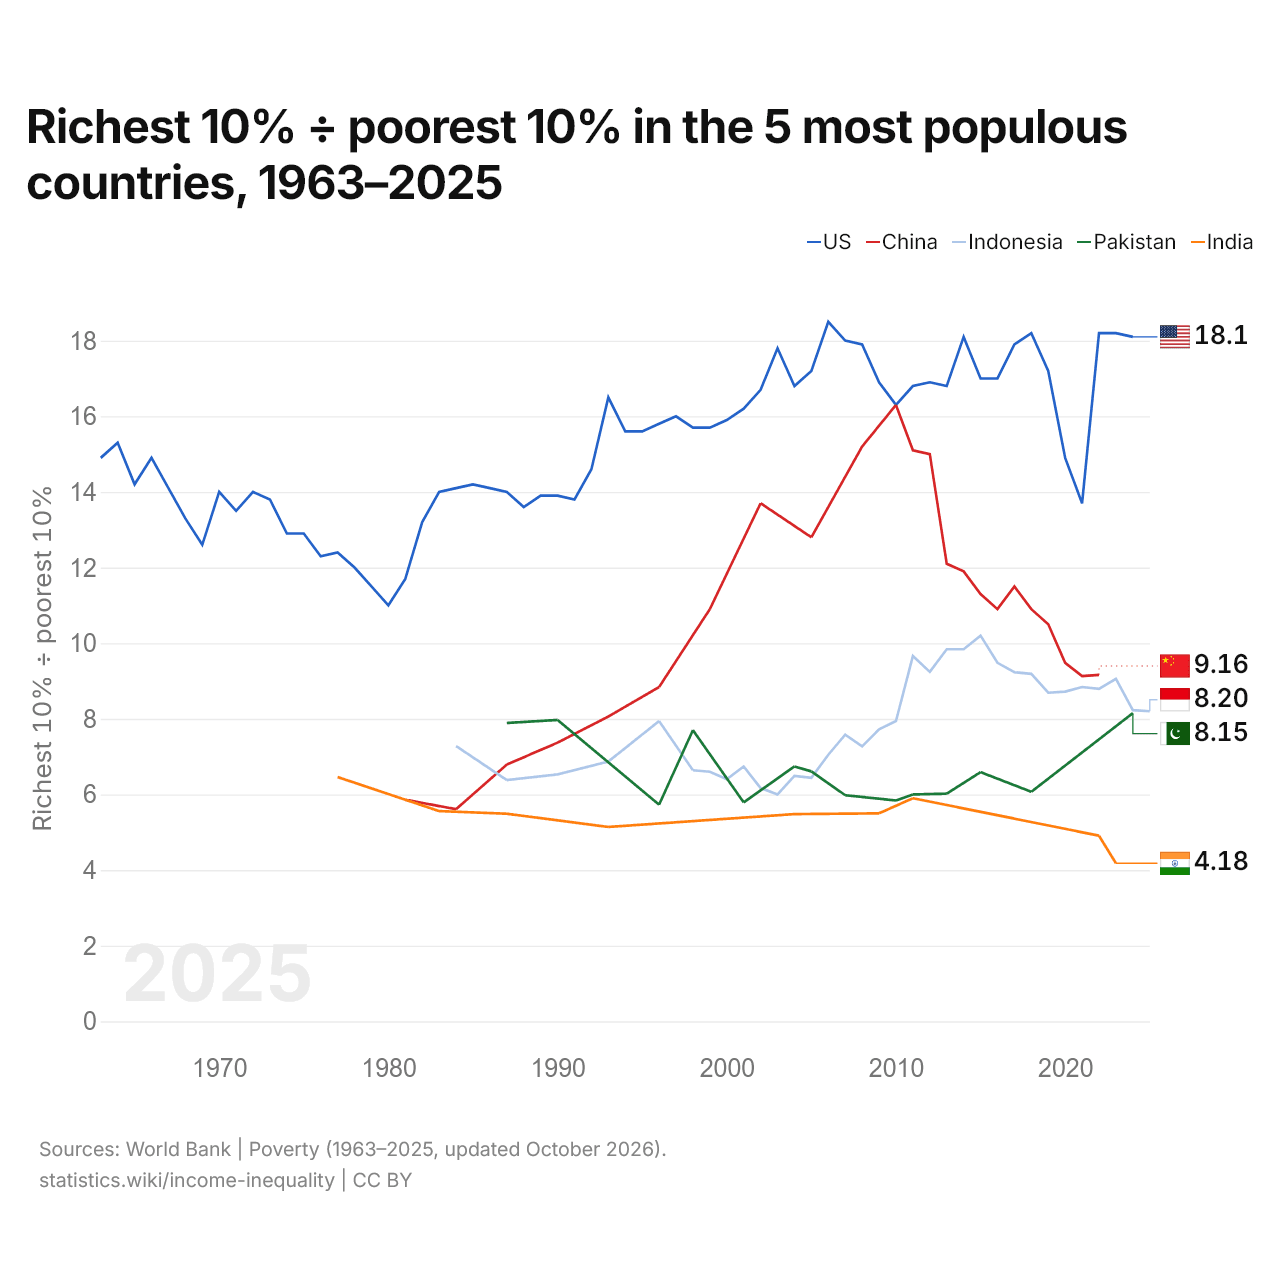
Richest 10% ÷ poorest 10% in the 5 most populous countries, 1963–2025
| Year | Richest 10% ÷ poorest 10% | ||||
|---|---|---|---|---|---|
| United States | China | Indonesia | Pakistan | India | |
| 2025 | - | - | 8.2 | - | - |
| 2024 | 18.1 | - | 8.23 | 8.15 | - |
| 2023 | 18.2 | - | 9.06 | - | 4.18 |
| 2022 | 18.2 | 9.16 | 8.79 | - | 4.91 |
| 2021 | 13.7 | 9.13 | 8.84 | - | - |
| 2020 | 14.9 | 9.48 | 8.72 | - | - |
| 2019 | 17.2 | 10.5 | 8.69 | - | - |
| 2018 | 18.2 | 10.9 | 9.19 | 6.07 | - |
| 2017 | 17.9 | 11.5 | 9.23 | - | - |
| 2016 | 17 | 10.9 | 9.48 | - | - |
| 2015 | 17 | 11.3 | 10.2 | 6.59 | - |
| 2014 | 18.1 | 11.9 | 9.84 | - | - |
| 2013 | 16.8 | 12.1 | 9.84 | 6.02 | - |
| 2012 | 16.9 | 15 | 9.24 | - | - |
| 2011 | 16.8 | 15.1 | 9.66 | 6 | 5.9 |
| 2010 | 16.3 | 16.3 | 7.94 | 5.84 | - |
| 2009 | 16.9 | - | 7.72 | - | 5.5 |
| 2008 | 17.9 | 15.2 | 7.27 | - | - |
| 2007 | 18 | - | 7.58 | 5.98 | - |
| 2006 | 18.5 | - | 7.05 | - | - |
| 2005 | 17.2 | 12.8 | 6.44 | 6.61 | - |
| 2004 | 16.8 | - | 6.49 | 6.74 | 5.48 |
| 2003 | 17.8 | - | 6 | - | - |
| 2002 | 16.7 | 13.7 | 6.17 | - | - |
| 2001 | 16.2 | - | 6.74 | 5.79 | - |
| 2000 | 15.9 | - | 6.4 | - | - |
| 1999 | 15.7 | 10.9 | 6.6 | - | - |
| 1998 | 15.7 | - | 6.64 | 7.7 | - |
| 1997 | 16 | - | - | - | - |
| 1996 | 15.8 | 8.84 | 7.94 | 5.73 | - |
| 1995 | 15.6 | - | - | - | - |
| 1994 | 15.6 | - | - | - | - |
| 1993 | 16.5 | 8.06 | 6.87 | - | 5.14 |
| 1992 | 14.6 | - | - | - | - |
| 1991 | 13.8 | - | - | - | - |
| 1990 | 13.9 | 7.37 | 6.53 | 7.97 | - |
| 1989 | 13.9 | - | - | - | - |
| 1988 | 13.6 | - | - | - | - |
| 1987 | 14 | 6.79 | 6.38 | 7.89 | 5.49 |
| 1986 | 14.1 | - | - | - | - |
| 1985 | 14.2 | - | - | - | - |
| 1984 | 14.1 | 5.61 | 7.28 | - | - |
| 1983 | 14 | - | - | - | 5.56 |
| 1982 | 13.2 | - | - | - | - |
| 1981 | 11.7 | 5.86 | - | - | - |
| 1980 | 11 | - | - | - | - |
| 1979 | 11.5 | - | - | - | - |
| 1978 | 12 | - | - | - | - |
| 1977 | 12.4 | - | - | - | 6.46 |
| 1976 | 12.3 | - | - | - | - |
| 1975 | 12.9 | - | - | - | - |
| 1974 | 12.9 | - | - | - | - |
| 1973 | 13.8 | - | - | - | - |
| 1972 | 14 | - | - | - | - |
| 1971 | 13.5 | - | - | - | - |
| 1970 | 14 | - | - | - | - |
| 1969 | 12.6 | - | - | - | - |
| 1968 | 13.3 | - | - | - | - |
| 1967 | 14.1 | - | - | - | - |
| 1966 | 14.9 | - | - | - | - |
| 1965 | 14.2 | - | - | - | - |
| 1964 | 15.3 | - | - | - | - |
| 1963 | 14.9 | - | - | - | - |
Of the five most populous countries, the richest 10% receive the largest multiple of the poorest 10%'s income in the United States, 18.1 times, and the smallest in India, 4.2 times. In China, the ratio has risen from 5.9 in 1981 to 9.2, the largest change among them.
Compare the income inequality of any 2 countries
Sources:
- World Bank | Poverty (1963–2025, updated October 2026)
Creative Commons Attribution (CC BY): you may copy, share, adapt and reuse this content, also commercially, as long as you credit statistics.wiki and note any changes you made. The sources listed above may have their own license terms.