
List of countries by GNI per capita (2025)
| Rank | Country | Atlas method, current $ | PPP, international $ | World Bank income group |
|---|---|---|---|---|
 World |
$14,270 | $25,517 | ||
| 1 |  Liechtenstein |
$116,380 (2009) | n/a | High |
| 2 |  Switzerland |
$110,330 | $101,690 | High |
| 3 |  Norway |
$97,310 | $107,770 | High |
| 4 |  Luxembourg |
$95,720 | $106,640 | High |
| 5 |  Iceland |
$89,220 | $83,250 | High |
| 6 |  United States |
$88,810 | $89,490 | High |
| 7 |  Ireland |
$87,360 | $106,310 | High |
| 8 |  Cayman Islands |
$81,920 (2024) | $74,470 (2024) | High |
| 9 |  Singapore |
$81,760 | $135,750 | High |
| 10 |  Denmark |
$77,190 | $85,460 | High |
| 11 |  Qatar |
$74,330 | $126,290 | High |
| 12 |  Netherlands |
$68,530 | $85,480 | High |
| 13 |  Australia |
$64,120 | $69,930 | High |
| 14 |  Sweden |
$63,010 | $76,090 | High |
| 15 |  Austria |
$60,360 | $77,010 | High |
| 16 |  Germany |
$60,200 | $78,140 | High |
| 17 |  Belgium |
$59,500 | $75,620 | High |
| 18 |  Canada |
$56,420 | $66,820 | High |
| 19 |  Israel |
$56,180 | $58,870 | High |
| 20 |  Finland |
$55,250 | $66,300 | High |
| 21 |  United Kingdom |
$54,550 | $64,210 | High |
| 22 |  San Marino |
$53,910 (2023) | $71,920 (2023) | High |
| 23 |  Andorra |
$53,230 | $80,950 | High |
| 24 |  UAE |
$51,550 (2024) | $81,640 (2024) | High |
| 25 |  France |
$48,630 | $65,110 | High |
| 26 |  New Zealand |
$46,630 | $53,600 | High |
| 27 |  Italy |
$42,080 | $62,870 | High |
| 28 |  Malta |
$41,440 | $64,900 | High |
| 29 |  Kuwait |
$41,110 (2024) | $64,040 (2024) | High |
| 30 |  Taiwan |
$40,620 | n/a | High |
| 31 |  Japan |
$38,340 | $58,920 | High |
| 32 |  South Korea |
$37,880 | $64,210 | High |
| 33 |  Spain |
$37,120 | $59,830 | High |
| 34 |  Bahamas |
$37,020 (2024) | $39,610 (2024) | High |
| 35 |  Saudi Arabia |
$36,070 | $74,400 | High |
| 36 |  Slovenia |
$35,520 | $58,880 | High |
| 37 |  Brunei |
$34,790 | $95,420 | High |
| 38 |  Czech Republic |
$32,960 | $57,870 | High |
| 39 |  Estonia |
$32,310 | $51,370 | High |
| 40 |  Lithuania |
$30,500 | $55,010 | High |
| 41 |  Portugal |
$29,930 | $52,240 | High |
| 42 |  Bahrain |
$28,790 | $65,500 | High |
| 43 |  Guyana |
$28,470 | $80,300 | High |
| 44 |  Barbados |
$27,080 | $24,840 | High |
| 45 |  Slovakia |
$26,410 | $47,920 | High |
| 46 |  Cyprus |
$25,990 | $57,390 | High |
| 47 |  Poland |
$25,520 | $52,290 | High |
| 48 |  Croatia |
$25,360 | $50,410 | High |
| 48 |  Greece |
$25,360 | $44,310 | High |
| 50 |  Latvia |
$24,980 | $45,740 | High |
| 51 |  Saint Kitts |
$24,530 | $36,430 | High |
| 52 |  Uruguay |
$24,020 | $36,330 | High |
| 53 |  Hungary |
$23,850 | $48,630 | High |
| 54 |  Antigua |
$23,790 | $34,670 | High |
| 55 |  Curacao |
$22,570 (2024) | $33,330 (2024) | High |
| 56 |  Nauru |
$20,690 | $20,200 | High |
| 57 |  Romania |
$20,190 | $49,550 | High |
| 58 |  Palau |
$19,890 | $23,480 | High |
| 59 |  Oman |
$19,520 (2024) | $39,390 (2024) | High |
| 60 |  Seychelles |
$19,200 | $34,930 | High |
| 61 |  Panama |
$19,140 | $41,770 | High |
| 62 |  Trinidad |
$18,550 | $36,080 | High |
| 63 |  Costa Rica |
$17,930 | $30,760 | High |
| 64 |  Bulgaria |
$17,780 | $42,170 | High |
| 65 |  Chile |
$16,960 | $35,730 | High |
| 66 |  Turkey |
$16,300 | $44,630 | Upper-middle |
| 67 |  Russia |
$16,230 | $49,220 | High |
| 68 |  Argentina |
$14,650 | $31,920 | Upper-middle |
| 69 |  China |
$14,230 | $29,160 | Upper-middle |
| 70 |  Montenegro |
$14,150 | $35,700 | Upper-middle |
| 71 |  Mauritius |
$14,040 | $37,000 | Upper-middle |
| 72 |  Kazakhstan |
$13,740 | $41,090 | Upper-middle |
| 73 |  Mexico |
$13,730 | $25,070 | Upper-middle |
| 74 |  Serbia |
$13,480 | $31,780 | Upper-middle |
| 75 |  Saint Lucia |
$13,410 | $26,180 | Upper-middle |
| 76 |  Maldives |
$12,950 | $25,600 | Upper-middle |
| 77 |  Malaysia |
$12,380 | $40,070 | Upper-middle |
| 78 |  Albania |
$12,060 | $28,170 | Upper-middle |
| 79 |  Saint Vincent |
$12,000 | $22,340 | Upper-middle |
| 80 |  Grenada |
$11,660 | $20,170 | Upper-middle |
| 81 |  Dominica |
$10,690 | $22,130 | Upper-middle |
| 82 |  Dominican Republic |
$10,620 | $26,980 | Upper-middle |
| 83 |  Brazil |
$10,550 | $22,670 | Upper-middle |
| 84 |  Bosnia |
$9,940 | $25,810 | Upper-middle |
| 85 |  Tuvalu |
$9,780 | $11,000 | Upper-middle |
| 86 |  Marshall Islands |
$9,710 | $10,590 | Upper-middle |
| 87 |  North Macedonia |
$9,490 | $26,680 | Upper-middle |
| 88 |  Belarus |
$9,160 | $34,310 | Upper-middle |
| 89 |  Armenia |
$9,020 | $24,020 | Upper-middle |
| 90 |  Cuba |
$9,010 (2019) | n/a | Upper-middle |
| 91 |  Georgia |
$8,990 | $27,570 | Upper-middle |
| 92 |  Peru |
$8,430 | $17,540 | Upper-middle |
| 93 |  Gabon |
$8,090 | $21,660 | Upper-middle |
| 94 |  Moldova |
$8,050 | $19,990 | Upper-middle |
| 95 |  Colombia |
$7,900 | $22,250 | Upper-middle |
| 96 |  Jamaica |
$7,790 | $13,090 | Upper-middle |
| 97 |  Thailand |
$7,690 | $25,570 | Upper-middle |
| 98 |  Belize |
$7,530 | $14,230 | Upper-middle |
| 99 |  Botswana |
$7,390 | $19,960 | Upper-middle |
| 100 |  Azerbaijan |
$7,360 | $25,430 | Upper-middle |
| 101 |  Libya |
$7,250 | $17,150 | Upper-middle |
| 102 |  Ecuador |
$6,890 | $16,290 | Upper-middle |
| 103 |  Tonga |
$6,840 | $9,240 | Upper-middle |
| 104 |  Paraguay |
$6,750 | $19,390 | Upper-middle |
| 105 |  Guatemala |
$6,360 | $15,020 | Upper-middle |
| 106 |  Turkmenistan |
$6,340 | $22,830 | Upper-middle |
| 107 |  South Africa |
$6,270 | $15,600 | Upper-middle |
| 108 |  Fiji |
$6,230 | $15,360 | Upper-middle |
| 109 |  Mongolia |
$6,210 | $18,460 | Upper-middle |
| 110 |  Suriname |
$6,140 | $21,000 | Upper-middle |
| 111 |  Equatorial Guinea |
$5,890 | $14,610 | Upper-middle |
| 112 |  Algeria |
$5,850 | $18,240 | Upper-middle |
| 113 |  Iraq |
$5,690 | $14,290 | Upper-middle |
| 114 |  Samoa |
$5,640 | $9,300 | Upper-middle |
| 115 |  Cape Verde |
$5,590 | $12,010 | Upper-middle |
| 116 |  El Salvador |
$5,410 | $13,140 | Upper-middle |
| 117 |  Jordan |
$5,260 | $12,440 | Upper-middle |
| 118 |  Ukraine |
$5,170 | $18,750 | Upper-middle |
| 119 |  Indonesia |
$5,120 | $17,190 | Upper-middle |
| 120 |  Vietnam |
$4,970 | $17,580 | Upper-middle |
| 121 |  Philippines |
$4,850 | $14,460 | Upper-middle |
| 122 |  Sri Lanka |
$4,670 | $16,750 | Upper-middle |
| 123 |  Iran |
$4,650 | $19,660 | Upper-middle |
| 124 |  Morocco |
$4,430 | $10,960 | Lower-middle |
| 125 |  Bolivia |
$4,420 | $12,530 | Lower-middle |
| 126 |  Vanuatu |
$4,410 | $4,970 | Lower-middle |
| 127 |  Namibia |
$4,340 | $11,260 | Lower-middle |
| 128 |  Bhutan |
$4,310 | $18,520 | Lower-middle |
| 129 |  Tunisia |
$4,300 | $14,870 | Lower-middle |
| 130 |  Djibouti |
$3,960 | $8,660 | Lower-middle |
| 131 |  Kiribati |
$3,930 | $6,080 | Lower-middle |
| 132 |  Venezuela |
$3,860 | $20,840 (2011) | Lower-middle |
| 133 |  Sao Tome |
$3,800 | $6,920 | Lower-middle |
| 134 |  Eswatini |
$3,730 | $11,390 | Lower-middle |
| 135 |  Uzbekistan |
$3,670 | $13,640 | Lower-middle |
| 136 |  Lebanon |
$3,560 (2024) | $11,790 (2024) | Lower-middle |
| 137 |  Honduras |
$3,270 | $7,270 | Lower-middle |
| 138 |  Egypt |
$3,260 | $19,330 | Lower-middle |
| 139 |  Palestine |
$3,250 | $5,310 | Lower-middle |
| 140 |  Papua New Guinea |
$2,890 | $4,840 | Lower-middle |
| 141 |  Angola |
$2,860 | $9,840 | Lower-middle |
| 142 |  Nicaragua |
$2,850 | $8,780 | Lower-middle |
| 143 |  Bangladesh |
$2,840 | $10,710 | Lower-middle |
| 144 |  Kyrgyzstan |
$2,800 | $9,120 | Lower-middle |
| 145 |  Ivory Coast |
$2,780 | $7,750 | Lower-middle |
| 146 |  India |
$2,760 | $11,600 | Lower-middle |
| 147 |  Cambodia |
$2,750 | $8,390 | Lower-middle |
| 148 |  Zimbabwe |
$2,660 | $6,390 | Lower-middle |
| 149 |  Ghana |
$2,630 | $8,080 | Lower-middle |
| 150 |  Congo |
$2,280 | $6,490 | Lower-middle |
| 151 |  Mauritania |
$2,210 | $7,640 | Lower-middle |
| 152 |  Kenya |
$2,200 | $6,910 | Lower-middle |
| 153 |  Laos |
$2,150 | $9,800 | Lower-middle |
| 154 |  Tajikistan |
$2,080 | $8,240 | Lower-middle |
| 155 |  Solomon Islands |
$2,020 | $2,790 | Lower-middle |
| 156 |  Haiti |
$2,010 | $3,130 | Lower-middle |
| 157 |  Comoros |
$1,950 | $4,260 | Lower-middle |
| 158 |  Cameroon |
$1,860 | $5,700 | Lower-middle |
| 159 |  Senegal |
$1,780 | $5,100 | Lower-middle |
| 160 |  Guinea |
$1,730 | $4,730 | Lower-middle |
| 161 |  Benin |
$1,600 | $4,760 | Lower-middle |
| 162 |  Nepal |
$1,570 | $6,250 | Lower-middle |
| 163 |  East Timor |
$1,510 | $5,120 | Lower-middle |
| 164 |  Pakistan |
$1,500 | $6,430 | Lower-middle |
| 165 |  Nigeria |
$1,360 | $9,230 | Lower-middle |
| 166 |  Togo |
$1,350 | $4,090 | Lower-middle |
| 167 |  Myanmar |
$1,320 | $5,890 | Lower-middle |
| 168 |  Lesotho |
$1,280 | $3,900 | Lower-middle |
| 169 |  Tanzania |
$1,230 | $4,370 | Lower-middle |
| 170 |  Zambia |
$1,200 | $3,990 | Lower-middle |
| 171 |  Rwanda |
$1,150 | $4,070 | Low |
| 172 |  Mali |
$1,120 | $3,400 | Low |
| 172 |  Uganda |
$1,120 | $3,410 | Low |
| 174 |  Ethiopia |
$1,110 | $3,620 | Low |
| 175 |  Guinea-Bissau |
$1,090 | $3,320 | Low |
| 176 |  South Sudan |
$1,050 (2015) | $1,010 (2015) | Low |
| 177 |  Burkina Faso |
$980 | $2,890 | Low |
| 178 |  Chad |
$970 | $2,770 | Low |
| 179 |  Gambia |
$930 | $3,660 | Low |
| 180 |  Sudan |
$900 | $2,140 | Low |
| 181 |  Liberia |
$830 | $1,840 | Low |
| 181 |  Sierra Leone |
$830 | $3,690 | Low |
| 183 |  Syria |
$770 (2023) | $4,480 (2023) | Low |
| 184 |  Niger |
$750 | $2,150 | Low |
| 185 |  Yemen |
$740 (2018) | $3,020 (2013) | Low |
| 186 |  DR Congo |
$720 | $1,850 | Low |
| 187 |  Eritrea |
$650 (2011) | $1,720 (2011) | Low |
| 188 |  Somalia |
$640 | $1,640 | Low |
| 189 |  Malawi |
$600 | $1,880 | Low |
| 190 |  Mozambique |
$570 | $1,540 | Low |
| 191 |  CAR |
$560 | $1,390 | Low |
| 191 |  Madagascar |
$560 | $1,910 | Low |
| 193 |  Afghanistan |
$390 (2024) | $2,250 (2024) | Low |
| 194 |  Burundi |
$240 | $1,250 | Low |
The list ranks 194 countries by their latest GNI per capita by the Atlas method, from Liechtenstein ($116,380, 2009) to Burundi ($240). The world's GNI per capita was $14,270 in 2025. Half of the countries had a GNI per capita below $7,610.
GNI (gross national income) per capita is the income of a country's residents in a year divided by its population: GDP plus the income they receive from abroad, minus the income paid to the rest of the world. The World Bank's Atlas method converts it into US dollars at an exchange rate averaged over three years and adjusted for inflation, which evens out short swings of currencies; the World Bank sorts countries into its four income groups by these figures. The PPP column converts it at purchasing power parity instead, which values every country's goods and services at the same prices.
Countries by World Bank income group
-
Andorra
-
Antigua
-
Australia
-
Austria
-
Bahamas
-
Bahrain
-
Barbados
-
Belgium
-
Brunei
-
Bulgaria
-
Canada
-
Cayman Islands
-
Chile
-
Costa Rica
-
Croatia
-
Curacao
-
Cyprus
-
Czech Republic
-
Denmark
-
Estonia
-
Finland
-
France
-
Germany
-
Greece
-
Guyana
-
Hungary
-
Iceland
-
Ireland
-
Israel
-
Italy
-
Japan
-
Kuwait
-
Latvia
-
Liechtenstein
-
Lithuania
-
Luxembourg
-
Malta
-
 Monaco
-
Nauru
-
Netherlands
-
New Zealand
-
Norway
-
Oman
-
Palau
-
Panama
-
Poland
-
Portugal
-
Qatar
-
Romania
-
Russia
-
Saint Kitts
-
San Marino
-
Saudi Arabia
-
Seychelles
-
Singapore
-
Slovakia
-
Slovenia
-
South Korea
-
Spain
-
Sweden
-
Switzerland
-
Taiwan
-
Trinidad
-
UAE
-
United Kingdom
-
United States
-
Uruguay
-
 Vatican
-
Albania
-
Algeria
-
Argentina
-
Armenia
-
Azerbaijan
-
Belarus
-
Belize
-
Bosnia
-
Botswana
-
Brazil
-
Cape Verde
-
China
-
Colombia
-
Cuba
-
Dominica
-
Dominican Republic
-
Ecuador
-
El Salvador
-
Equatorial Guinea
-
Fiji
-
Gabon
-
Georgia
-
Grenada
-
Guatemala
-
Indonesia
-
Iran
-
Iraq
-
Jamaica
-
Jordan
-
Kazakhstan
-
Libya
-
Malaysia
-
Maldives
-
Marshall Islands
-
Mauritius
-
Mexico
-
Moldova
-
Mongolia
-
Montenegro
-
North Macedonia
-
Paraguay
-
Peru
-
Philippines
-
Saint Lucia
-
Saint Vincent
-
Samoa
-
Serbia
-
South Africa
-
Sri Lanka
-
Suriname
-
Thailand
-
Tonga
-
Turkey
-
Turkmenistan
-
Tuvalu
-
Ukraine
-
Vietnam
-
Angola
-
Bangladesh
-
Benin
-
Bhutan
-
Bolivia
-
Cambodia
-
Cameroon
-
Comoros
-
Congo
-
Djibouti
-
East Timor
-
Egypt
-
Eswatini
-
Ghana
-
Guinea
-
Haiti
-
Honduras
-
India
-
Ivory Coast
-
Kenya
-
Kiribati
-
Kyrgyzstan
-
Laos
-
Lebanon
-
Lesotho
-
Mauritania
-
Morocco
-
Myanmar
-
Namibia
-
Nepal
-
Nicaragua
-
Nigeria
-
Pakistan
-
Palestine
-
Papua New Guinea
-
Sao Tome
-
Senegal
-
Solomon Islands
-
Tajikistan
-
Tanzania
-
Togo
-
Tunisia
-
Uzbekistan
-
Vanuatu
-
Venezuela
-
Zambia
-
Zimbabwe

The World Bank puts 68 countries in its high-income group, 57 in the upper-middle-income group, 47 in the lower-middle-income group and 25 in the low-income group.
GNI per capita by country map
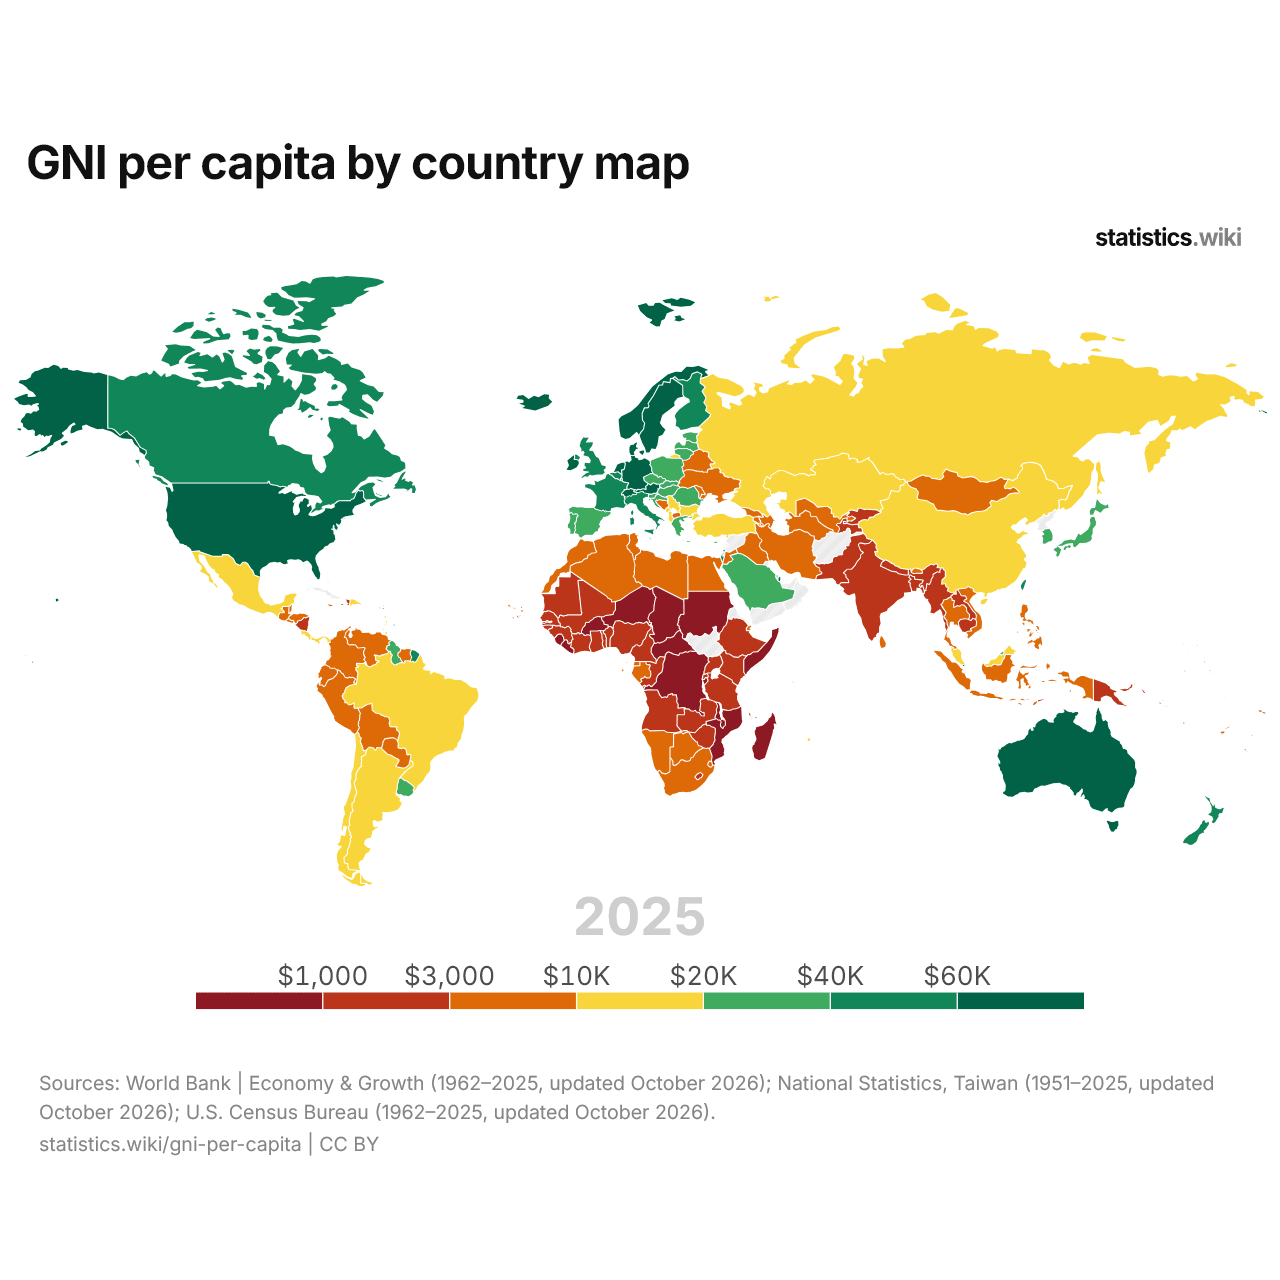
In 2025, GNI per capita was above $40,000 in 25 countries and below $1,000 in 14; in 1986, it was above $40,000 in 0 and below $1,000 in 66.
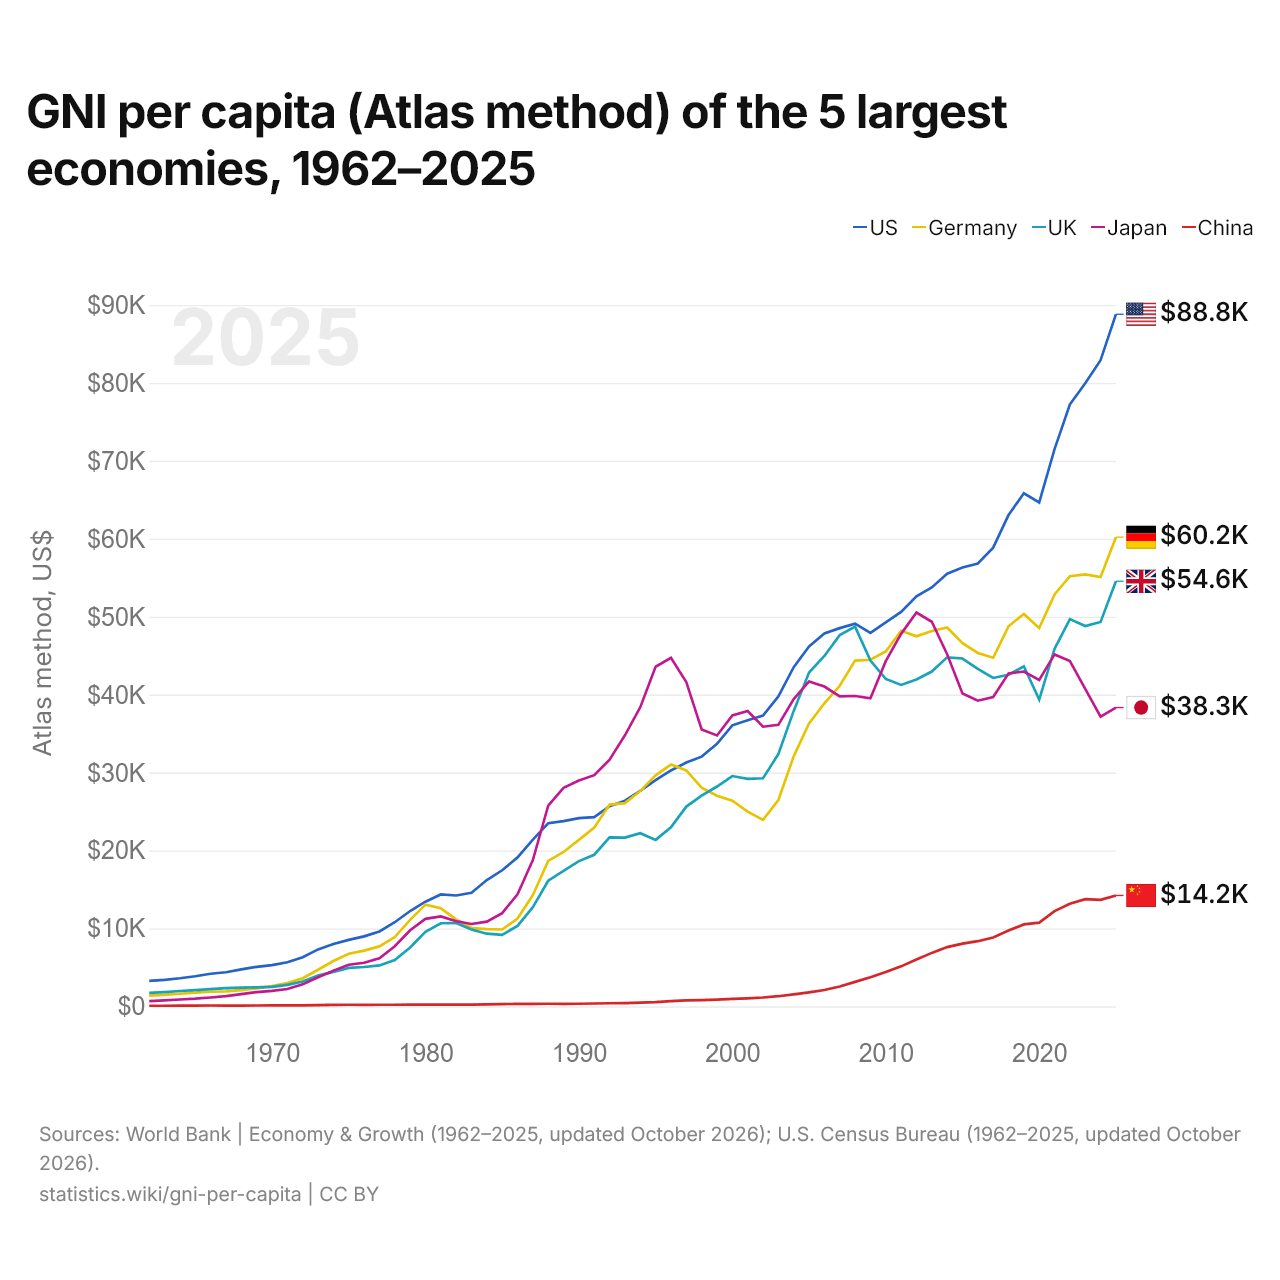
GNI per capita (Atlas method) of the 5 largest economies, 1962–2025
| Year | Atlas method, US$ | ||||
|---|---|---|---|---|---|
| United States | Germany | United Kingdom | Japan | China | |
| 2025 | $88,810 | $60,200 | $54,550 | $38,340 | $14,230 |
| 2024 | $82,910 | $55,090 | $49,320 | $37,170 | $13,660 |
| 2023 | $79,950 | $55,420 | $48,800 | $40,740 | $13,750 |
| 2022 | $77,230 | $55,200 | $49,690 | $44,300 | $13,170 |
| 2021 | $71,510 | $52,850 | $45,880 | $45,160 | $12,220 |
| 2020 | $64,660 | $48,540 | $39,350 | $41,880 | $10,740 |
| 2019 | $65,840 | $50,350 | $43,640 | $42,960 | $10,510 |
| 2018 | $63,040 | $48,770 | $42,540 | $42,720 | $9,720 |
| 2017 | $58,860 | $44,730 | $42,140 | $39,700 | $8,830 |
| 2016 | $56,830 | $45,340 | $43,310 | $39,220 | $8,360 |
| 2015 | $56,320 | $46,590 | $44,630 | $40,140 | $8,040 |
| 2014 | $55,520 | $48,610 | $44,780 | $45,180 | $7,600 |
| 2013 | $53,750 | $48,160 | $42,960 | $49,350 | $6,860 |
| 2012 | $52,610 | $47,480 | $41,940 | $50,540 | $6,010 |
| 2011 | $50,620 | $48,200 | $41,240 | $47,800 | $5,130 |
| 2010 | $49,280 | $45,530 | $42,010 | $44,290 | $4,410 |
| 2009 | $47,910 | $44,470 | $44,370 | $39,540 | $3,740 |
| 2008 | $49,110 | $44,360 | $48,720 | $39,820 | $3,140 |
| 2007 | $48,530 | $41,130 | $47,640 | $39,770 | $2,550 |
| 2006 | $47,850 | $38,890 | $44,960 | $41,030 | $2,090 |
| 2005 | $46,190 | $36,310 | $42,840 | $41,690 | $1,790 |
| 2004 | $43,520 | $32,080 | $37,910 | $39,430 | $1,530 |
| 2003 | $39,770 | $26,470 | $32,370 | $36,120 | $1,300 |
| 2002 | $37,320 | $23,920 | $29,260 | $35,880 | $1,130 |
| 2001 | $36,710 | $24,990 | $29,190 | $37,890 | $1,020 |
| 2000 | $36,060 | $26,380 | $29,550 | $37,330 | $950 |
| 1999 | $33,680 | $27,020 | $28,210 | $34,750 | $860 |
| 1998 | $32,040 | $28,070 | $27,040 | $35,530 | $800 |
| 1997 | $31,280 | $30,270 | $25,630 | $41,610 | $760 |
| 1996 | $30,270 | $31,020 | $22,970 | $44,730 | $660 |
| 1995 | $29,040 | $29,650 | $21,360 | $43,580 | $540 |
| 1994 | $27,660 | $27,630 | $22,210 | $38,380 | $470 |
| 1993 | $26,390 | $26,080 | $21,650 | $34,780 | $420 |
| 1992 | $25,680 | $25,890 | $21,690 | $31,650 | $400 |
| 1991 | $24,270 | $22,950 | $19,450 | $29,660 | $360 |
| 1990 | $24,150 | $21,360 | $18,640 | $28,990 | $330 |
| 1989 | $23,770 | $19,810 | $17,390 | $28,050 | $320 |
| 1988 | $23,490 | $18,670 | $16,120 | $25,750 | $330 |
| 1987 | $21,390 | $14,280 | $12,730 | $18,770 | $320 |
| 1986 | $19,110 | $11,270 | $10,330 | $14,380 | $310 |
| 1985 | $17,460 | $9,860 | $9,180 | $11,950 | $290 |
| 1984 | $16,210 | $9,900 | $9,320 | $10,870 | $250 |
| 1983 | $14,570 | $10,050 | $9,870 | $10,570 | $220 |
| 1982 | $14,220 | $11,150 | $10,690 | $10,920 | $220 |
| 1981 | $14,360 | $12,580 | $10,660 | $11,530 | $220 |
| 1980 | $13,430 | $13,050 | $9,550 | $11,230 | $220 |
| 1979 | $12,230 | $11,090 | $7,540 | $9,770 | $210 |
| 1978 | $10,790 | $8,890 | $5,940 | $7,710 | $200 |
| 1977 | $9,610 | $7,690 | $5,250 | $6,150 | $200 |
| 1976 | $8,980 | $7,150 | $5,050 | $5,590 | $190 |
| 1975 | $8,530 | $6,740 | $4,940 | $5,340 | $200 |
| 1974 | $8,000 | $5,810 | $4,420 | $4,580 | $180 |
| 1973 | $7,310 | $4,690 | $3,940 | $3,740 | $160 |
| 1972 | $6,300 | $3,610 | $3,190 | $2,820 | $130 |
| 1971 | $5,650 | $2,980 | $2,750 | $2,230 | $130 |
| 1970 | $5,290 | $2,600 | $2,490 | $1,980 | $120 |
| 1969 | $5,070 | $2,300 | $2,430 | $1,830 | $110 |
| 1968 | $4,740 | $2,080 | $2,410 | $1,560 | $90 |
| 1967 | $4,370 | $1,910 | $2,340 | $1,310 | $100 |
| 1966 | $4,180 | $1,870 | $2,210 | $1,130 | $110 |
| 1965 | $3,860 | $1,760 | $2,080 | $980 | $100 |
| 1964 | $3,600 | $1,620 | $1,970 | $880 | $90 |
| 1963 | $3,400 | $1,480 | $1,830 | $760 | $80 |
| 1962 | $3,270 | $1,370 | $1,720 | $670 | $70 |
In 2025, GNI per capita was $88,810 in the United States, $60,200 in Germany, $54,550 in the United Kingdom, $38,340 in Japan and $14,230 in China. The United States' GNI per capita has been the highest of the five since 2002. The most recent change in their order came in 2021, when the United Kingdom passed Japan.
Compare the GNI per capita of any 2 countries
Sources:
- World Bank | Economy & Growth (1962–2025, updated October 2026)
- National Statistics, Taiwan (1951–2025, updated October 2026)
- U.S. Census Bureau (1962–2025, updated October 2026)
- Central Intelligence Agency (CIA) (2025, updated October 2026)
Creative Commons Attribution (CC BY): you may copy, share, adapt and reuse this content, also commercially, as long as you credit statistics.wiki and note any changes you made. The sources listed above may have their own license terms.