
Tuvalu GNI per capita, 1972–2025
| Year | GNI per capita | World rank | |
|---|---|---|---|
| Atlas method | PPP | ||
| 2025 | $9,780 | $11,000 | #85 |
| 2024 | $7,970 | $8,820 | #89 |
| 2023 | $7,520 | $7,850 | #91 |
| 2022 | $7,460 | $7,450 | #89 |
| 2021 | $7,460 | $7,440 | #84 |
| 2020 | $6,920 | $7,060 | #85 |
| 2019 | $6,860 | $6,960 | #88 |
| 2018 | $6,230 | $6,430 | #91 |
| 2017 | $5,320 | $5,870 | #98 |
| 2016 | $5,390 | $5,840 | #99 |
| 2015 | $5,650 | $5,850 | #96 |
| 2014 | $4,790 | $4,510 | #108 |
| 2013 | $5,580 | $5,040 | #101 |
| 2012 | $4,460 | $4,090 | #107 |
| 2011 | $4,740 | $4,760 | #103 |
| 2010 | $4,460 | $4,730 | #100 |
| 2009 | $4,890 | $5,290 | #88 |
| 2008 | $4,790 | $5,230 | #87 |
| 2007 | $4,650 | $5,310 | #85 |
| 2006 | $3,900 | $4,540 | #86 |
| 2005 | $3,800 | $4,580 | #81 |
| 2004 | $3,380 | $4,610 | #78 |
| 2003 | $2,610 | $4,200 | #80 |
| 2002 | $3,420 | $5,980 | #72 |
| 2001 | $2,780 | $4,820 | #78 |
| 2000 | $2,350 | $4,040 | #81 |
| 1999 | $2,710 | $4,570 | #79 |
| 1998 | $2,940 | $4,710 | #74 |
| 1997 | $2,860 | $4,340 | #74 |
| 1996 | $2,350 | $3,640 | #81 |
| 1995 | $2,450 | $4,020 | #78 |
| 1994 | $2,520 | $4,130 | #73 |
| 1993 | $2,220 | $3,510 | #74 |
| 1992 | $2,410 | $3,680 | #69 |
| 1991 | $2,300 | $3,480 | #68 |
| 1990 | $2,130 | $3,290 | #71 |
| 1989 | $1,720 | - | #74 |
| 1988 | $1,660 | - | #76 |
| 1987 | $1,320 | - | #77 |
| 1986 | $1,210 | - | #79 |
| 1985 | $1,020 | - | #84 |
| 1984 | $1,120 | - | #83 |
| 1983 | $1,080 | - | #83 |
| 1982 | $1,050 | - | #85 |
| 1981 | $1,290 | - | #74 |
| 1980 | $1,240 | - | #74 |
| 1979 | $1,180 | - | #69 |
| 1978 | $1,140 | - | #66 |
| 1977 | $1,180 | - | #59 |
| 1976 | $1,350 | - | #52 |
| 1975 | $1,440 | - | #47 |
| 1974 | $1,370 | - | #43 |
| 1973 | $1,160 | - | #41 |
| 1972 | $1,000 | - | #41 |
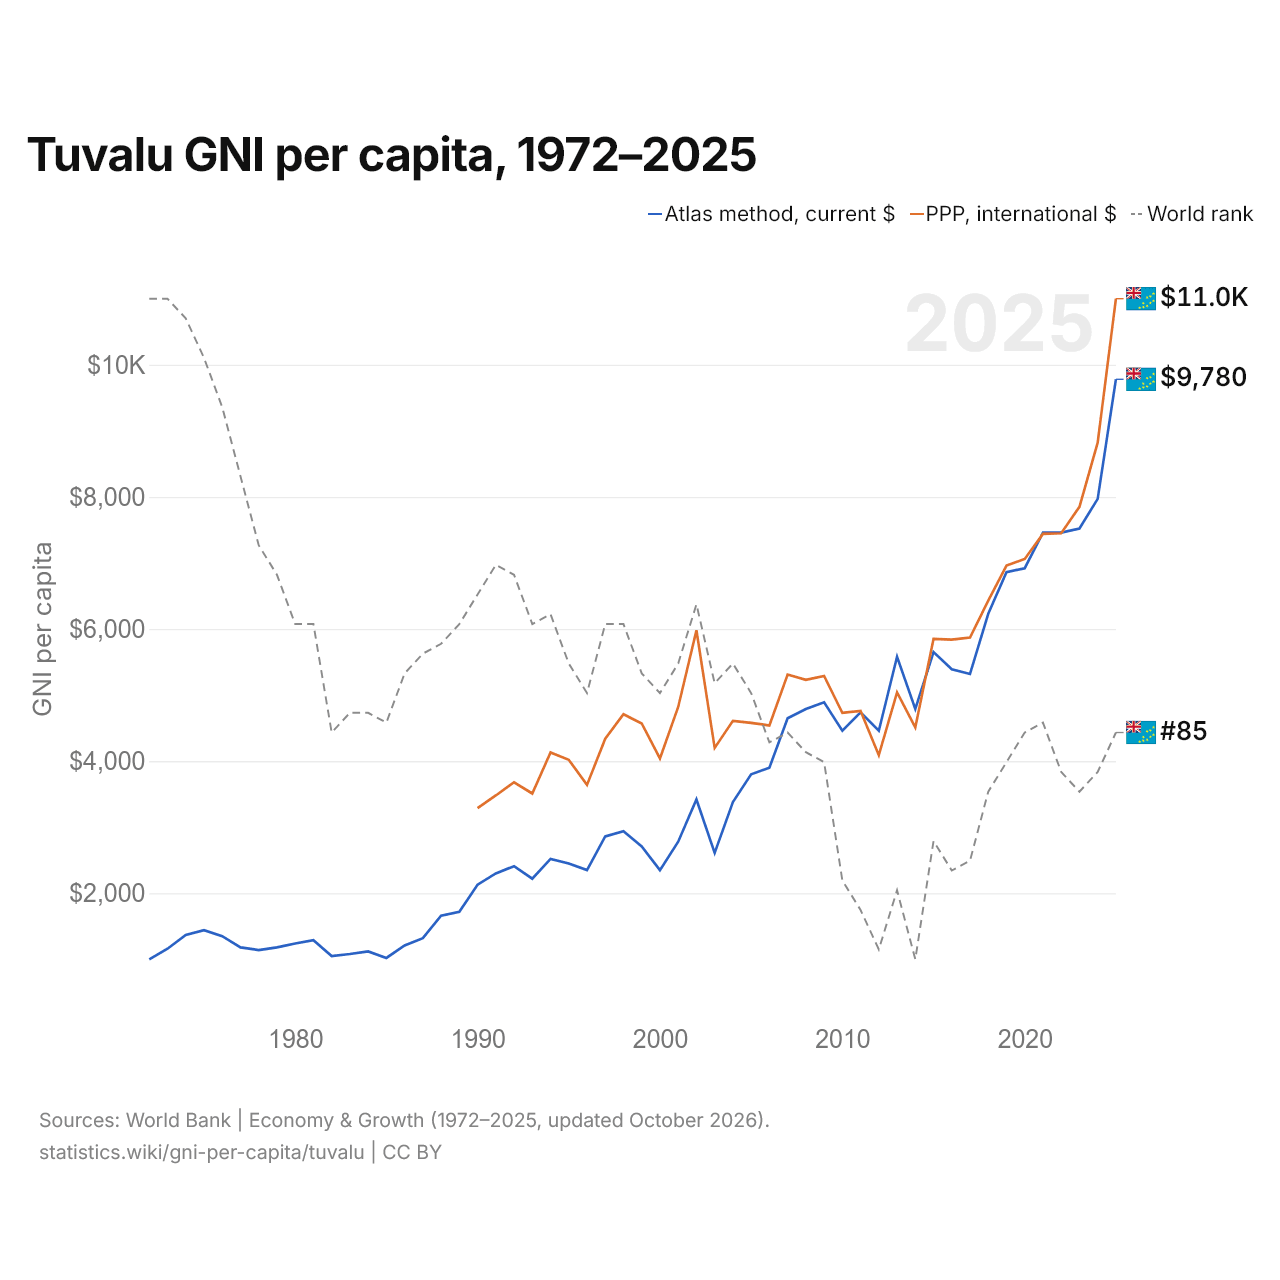
In 2025, Tuvalu's GNI per capita by the Atlas method was $9,780, up from $1,000 in 1972. Tuvalu's was 69% of the world's GNI per capita of $14,270. Converted at purchasing power parity, it was $11,000. It was the 85th highest in the world, up from 89th in 2024. Its highest rank was 41st, last held in 1973.
Tuvalu's GNI per capita was the 5th highest of the 13 countries of Oceania, where it ranged from the Solomon Islands' $2,020 to Australia's $64,120. The World Bank puts Tuvalu in its upper-middle-income group, where 18 countries had a higher GNI per capita and 38 a lower one.
Tuvalu in the world GNI per capita ranking, 2025
| Rank | Country | Atlas method | PPP | Income group | |
|---|---|---|---|---|---|
| 82 |
 Dominican Republic |
$10,620 | $26,980 | Upper-middle | |
| 83 |
 Brazil |
$10,550 | $22,670 | Upper-middle | |
| 84 |
 Bosnia |
$9,940 | $25,810 | Upper-middle | |
| 85 |
 Tuvalu |
$9,780 | $11,000 | Upper-middle | |
| 86 |
 Marshall Islands |
$9,710 | $10,590 | Upper-middle | |
| 87 |
 North Macedonia |
$9,490 | $26,680 | Upper-middle | |
| 88 |
 Belarus |
$9,160 | $34,310 | Upper-middle |
Compare Tuvalu GNI per capita with other countries
Sources:
- World Bank | Economy & Growth (1972–2025, updated October 2026)
Creative Commons Attribution (CC BY): you may copy, share, adapt and reuse this content, also commercially, as long as you credit statistics.wiki and note any changes you made. The sources listed above may have their own license terms.