
Guatemala energy consumption by year
| Year | Energy consumption, TWh | World rank |
|---|---|---|
| Guatemala | ||
| 2024 | 201.2 | #74 |
| 2023 | 197.1 | #74 |
| 2022 | 184.3 | #78 |
| 2021 | 189.2 | #74 |
| 2020 | 166.3 | #81 |
| 2019 | 169.4 | #80 |
| 2018 | 163.4 | #81 |
| 2017 | 157.6 | #83 |
| 2016 | 157.7 | #81 |
| 2015 | 146.2 | #81 |
| 2014 | 137.9 | #83 |
| 2013 | 132.2 | #83 |
| 2012 | 128.8 | #83 |
| 2011 | 122.9 | #85 |
| 2010 | 120.4 | #84 |
| 2009 | 119.3 | #82 |
| 2008 | 111.3 | #86 |
| 2007 | 114.4 | #83 |
| 2006 | 106.8 | #84 |
| 2005 | 106 | #85 |
| 2004 | 103.6 | #84 |
| 2003 | 100.5 | #85 |
| 2002 | 98.5 | #83 |
| 2001 | 86 | #89 |
| 2000 | 83.8 | #87 |
| 1999 | 79.8 | #91 |
| 1998 | 72.4 | #93 |
| 1997 | 66.6 | #97 |
| 1996 | 63.7 | #97 |
| 1995 | 61.9 | #96 |
| 1994 | 58.5 | #98 |
| 1993 | 55.5 | #100 |
| 1992 | 55.7 | #101 |
| 1991 | 52.8 | #102 |
| 1990 | 51.3 | #102 |
| 1989 | 48 | #81 |
| 1988 | 46.3 | #81 |
| 1987 | 44.5 | #82 |
| 1986 | 42.1 | #81 |
| 1985 | 43.8 | #80 |
| 1984 | 43 | #81 |
| 1983 | 40.7 | #82 |
| 1982 | 42.2 | #81 |
| 1981 | 42.9 | #80 |
| 1980 | 44.1 | #78 |
| 1979 | 47.8 | #75 |
| 1978 | 45 | #77 |
| 1977 | 44 | #77 |
| 1976 | 41.4 | #74 |
| 1975 | 38.8 | #75 |
| 1974 | 35.2 | #74 |
| 1973 | 34.3 | #74 |
| 1972 | 32.8 | #74 |
| 1971 | 31.8 | #73 |
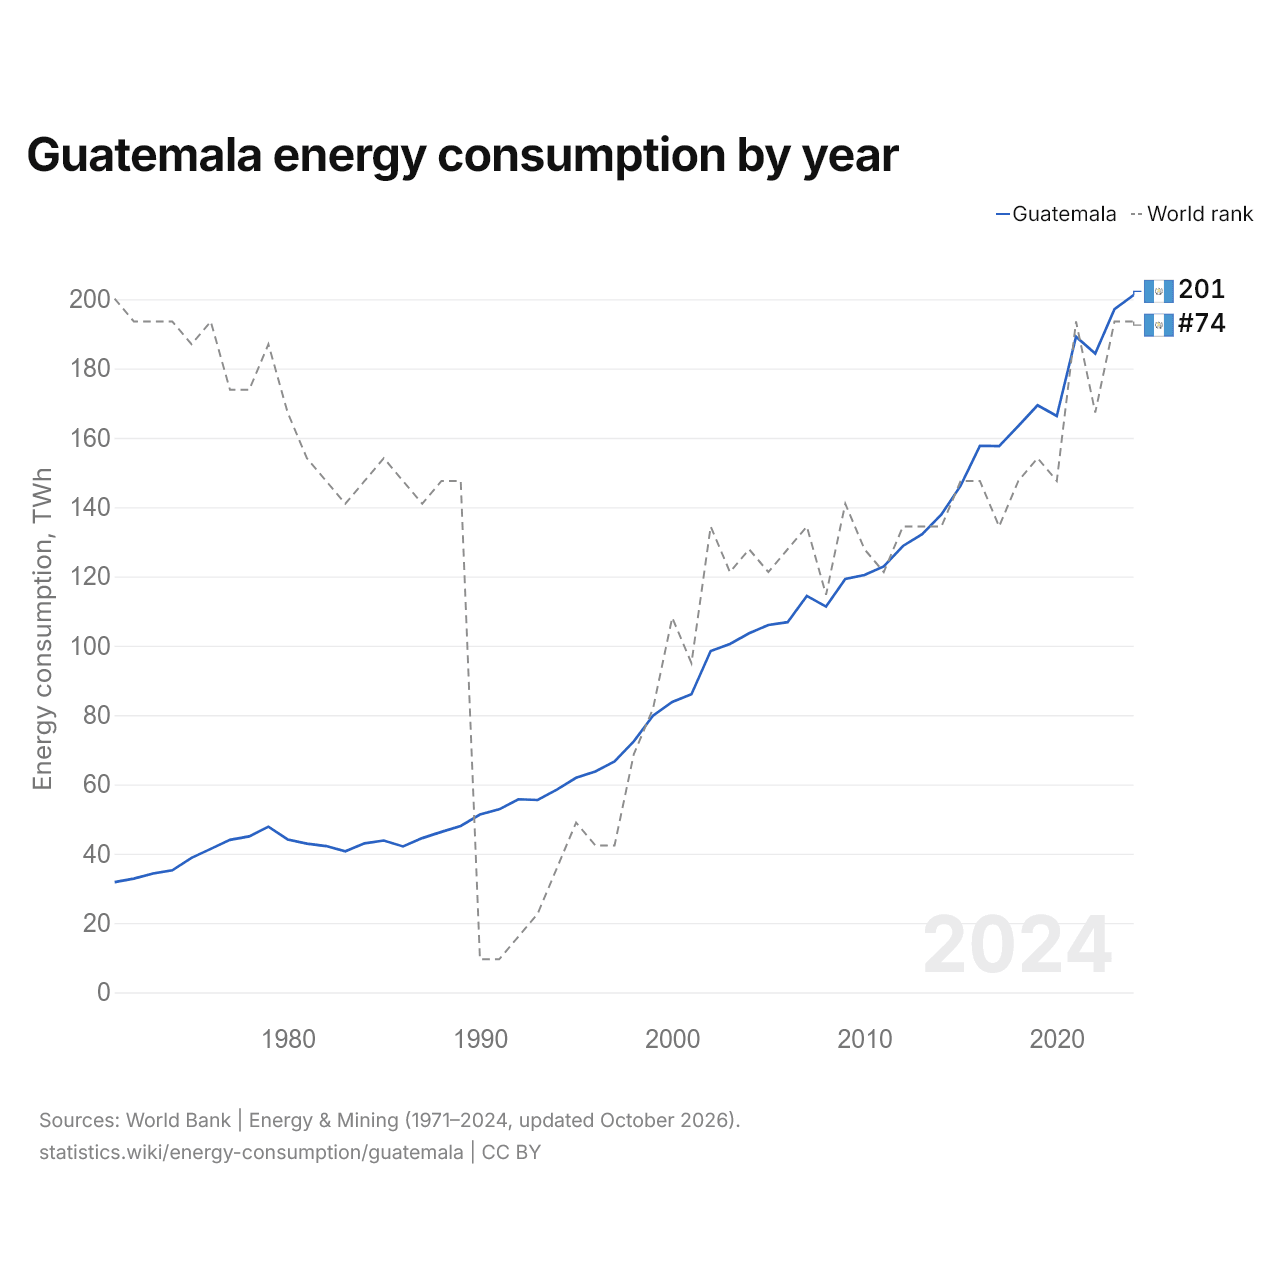
Energy consumption in Guatemala is 201 TWh, up from 31.8 TWh in 1971. It is the 74th largest energy consumer in the world, a rank it has held since 2023. Its highest rank was 73rd, last held in 1971.
Guatemala's energy consumption is the 8th largest of 24 countries in Latin America. Guatemala's electricity consumption is 743 kWh per person, the 113th highest in the world. The renewable share of final energy consumption in Guatemala is 62.1%, the 35th highest in the world.
Guatemala energy consumption per capita by year
| Year | Energy consumption, kWh per person | World rank |
|---|---|---|
| Guatemala | ||
| 2024 | 10,933 | #92 |
| 2023 | 10,873 | #93 |
| 2022 | 10,326 | #95 |
| 2021 | 10,749 | #93 |
| 2020 | 9,581 | #95 |
| 2019 | 9,905 | #98 |
| 2018 | 9,698 | #99 |
| 2017 | 9,510 | #105 |
| 2016 | 9,695 | #105 |
| 2015 | 9,157 | #105 |
| 2014 | 8,796 | #106 |
| 2013 | 8,595 | #106 |
| 2012 | 8,538 | #105 |
| 2011 | 8,307 | #108 |
| 2010 | 8,305 | #108 |
| 2009 | 8,389 | #109 |
| 2008 | 7,987 | #110 |
| 2007 | 8,378 | #106 |
| 2006 | 7,987 | #109 |
| 2005 | 8,101 | #108 |
| 2004 | 8,092 | #104 |
| 2003 | 8,026 | #93 |
| 2002 | 8,045 | #93 |
| 2001 | 7,183 | #98 |
| 2000 | 7,164 | #100 |
| 1999 | 6,987 | #102 |
| 1998 | 6,502 | #107 |
| 1997 | 6,135 | #111 |
| 1996 | 6,016 | #110 |
| 1995 | 6,006 | #108 |
| 1994 | 5,824 | #109 |
| 1993 | 5,675 | #114 |
| 1992 | 5,846 | #111 |
| 1991 | 5,691 | #113 |
| 1990 | 5,685 | #111 |
| 1989 | 5,474 | #86 |
| 1988 | 5,423 | #87 |
| 1987 | 5,361 | #88 |
| 1986 | 5,216 | #90 |
| 1985 | 5,586 | #84 |
| 1984 | 5,640 | #80 |
| 1983 | 5,490 | #84 |
| 1982 | 5,822 | #79 |
| 1981 | 6,063 | #78 |
| 1980 | 6,392 | #76 |
| 1979 | 7,097 | #72 |
| 1978 | 6,860 | #72 |
| 1977 | 6,866 | #71 |
| 1976 | 6,618 | #70 |
| 1975 | 6,323 | #70 |
| 1974 | 5,885 | #71 |
| 1973 | 5,874 | #72 |
| 1972 | 5,771 | #71 |
| 1971 | 5,742 | #71 |
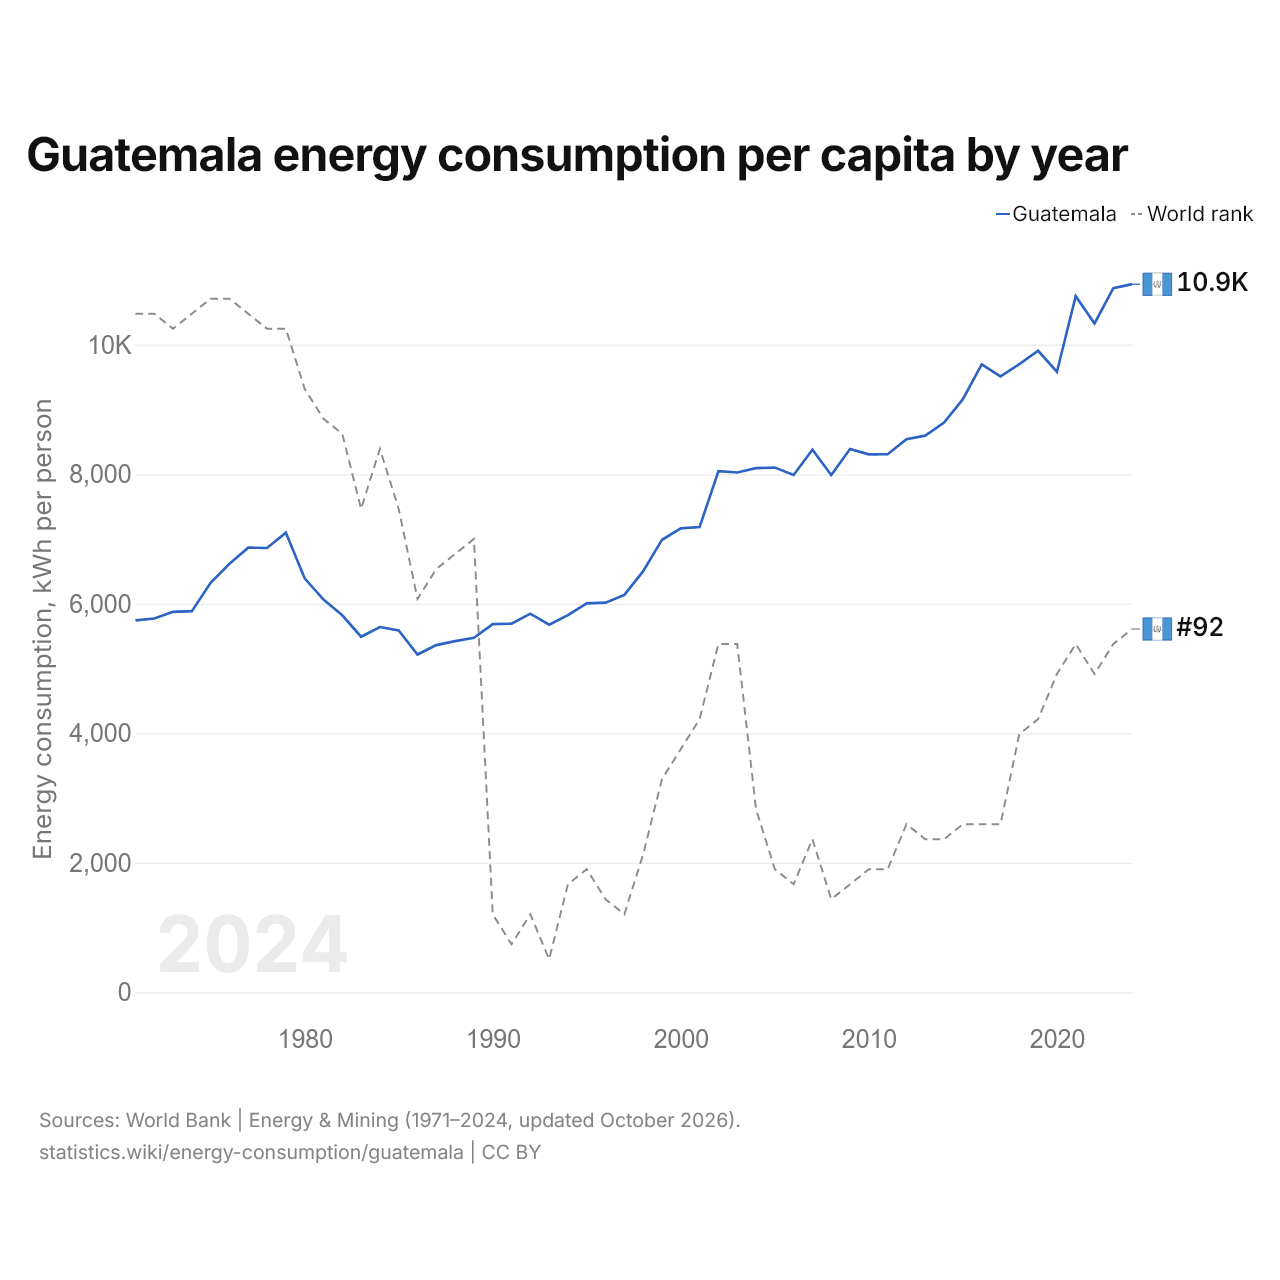
Energy consumption in Guatemala is 10,933 kWh per person, up from 5,742 kWh in 1971. Its consumption per person was lowest in 1986, at 5,216 kWh. It is the 92nd highest in the world, up from 93rd the year before. Its highest rank was 70th, last held in 1976.
Guatemala energy use by source: fossil fuels vs alternative and nuclear, %
| Year | Share of energy use, % | |
|---|---|---|
| Fossil fuels | Alternative and nuclear | |
| 2024 | - | 3.8% |
| 2023 | - | 4.2% |
| 2022 | 34.6% | 5.3% |
| 2021 | 35.6% | 5.5% |
| 2020 | 34.5% | 5.8% |
| 2019 | 38.6% | 4.8% |
| 2018 | 37.7% | 5.4% |
| 2017 | 35.2% | 5.9% |
| 2016 | 37.1% | 5% |
| 2015 | 37.4% | 4.7% |
| 2014 | 33.7% | 5.4% |
| 2013 | 33% | 5.2% |
| 2012 | 32.1% | 5.5% |
| 2011 | 32.5% | 5.4% |
| 2010 | 32.4% | 5.5% |
| 2009 | 36% | 5.7% |
| 2008 | 34.7% | 5.9% |
| 2007 | 37.6% | 5% |
| 2006 | 37.3% | 4.6% |
| 2005 | 37.5% | 4.3% |
| 2004 | 36.3% | 4.6% |
| 2003 | 37.1% | 4.4% |
| 2002 | 38.1% | 3.7% |
| 2001 | 41.4% | 5.2% |
| 2000 | 41.4% | 5.4% |
| 1999 | 40.2% | 3.4% |
| 1998 | 42.3% | 3% |
| 1997 | 38.3% | 2.8% |
| 1996 | 37.8% | 2.9% |
| 1995 | 36.7% | 3.1% |
| 1994 | 35.6% | 2.8% |
| 1993 | 31.7% | 2.8% |
| 1992 | 31% | 2.6% |
| 1991 | 28.6% | 3.3% |
| 1990 | 27.9% | 3.4% |
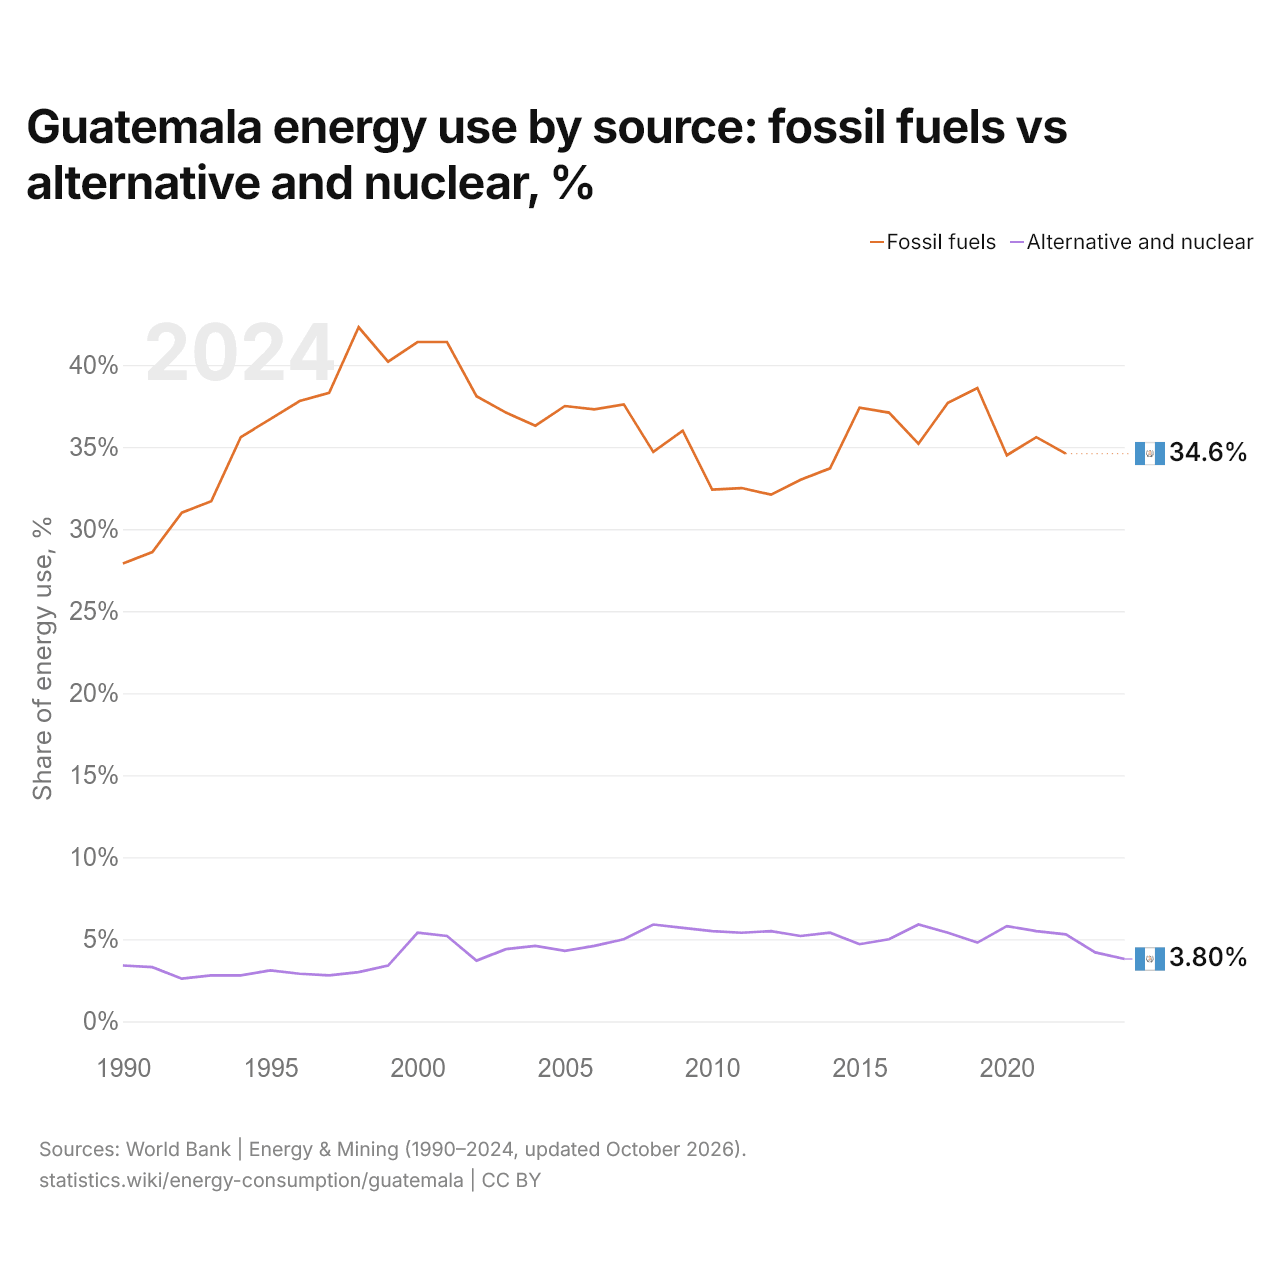
Fossil fuels made up 34.6% of Guatemala's energy use and alternative and nuclear energy 5.3%. In 1990, Guatemala's shares were 27.9% and 3.4%.
Guatemala net energy imports (imports minus exports), % of energy use
| Year | % of energy use |
|---|---|
| Guatemala | |
| 2024 | 40% |
| 2023 | 41.1% |
| 2022 | 38.4% |
| 2021 | 39.9% |
| 2020 | 34.7% |
| 2019 | 42.4% |
| 2018 | 35.7% |
| 2017 | 35.5% |
| 2016 | 37.5% |
| 2015 | 39.2% |
| 2014 | 33.4% |
| 2013 | 31.6% |
| 2012 | 30.4% |
| 2011 | 29.9% |
| 2010 | 29.1% |
| 2009 | 32.3% |
| 2008 | 28.6% |
| 2007 | 33.2% |
| 2006 | 29% |
| 2005 | 31.7% |
| 2004 | 20% |
| 2003 | 24% |
| 2002 | 24.5% |
| 2001 | 29% |
| 2000 | 26.9% |
| 1999 | 24.5% |
| 1998 | 27.3% |
| 1997 | 23.2% |
| 1996 | 26.8% |
| 1995 | 32.7% |
| 1994 | 33.7% |
| 1993 | 30.2% |
| 1992 | 30.3% |
| 1991 | 29.9% |
| 1990 | 26.3% |
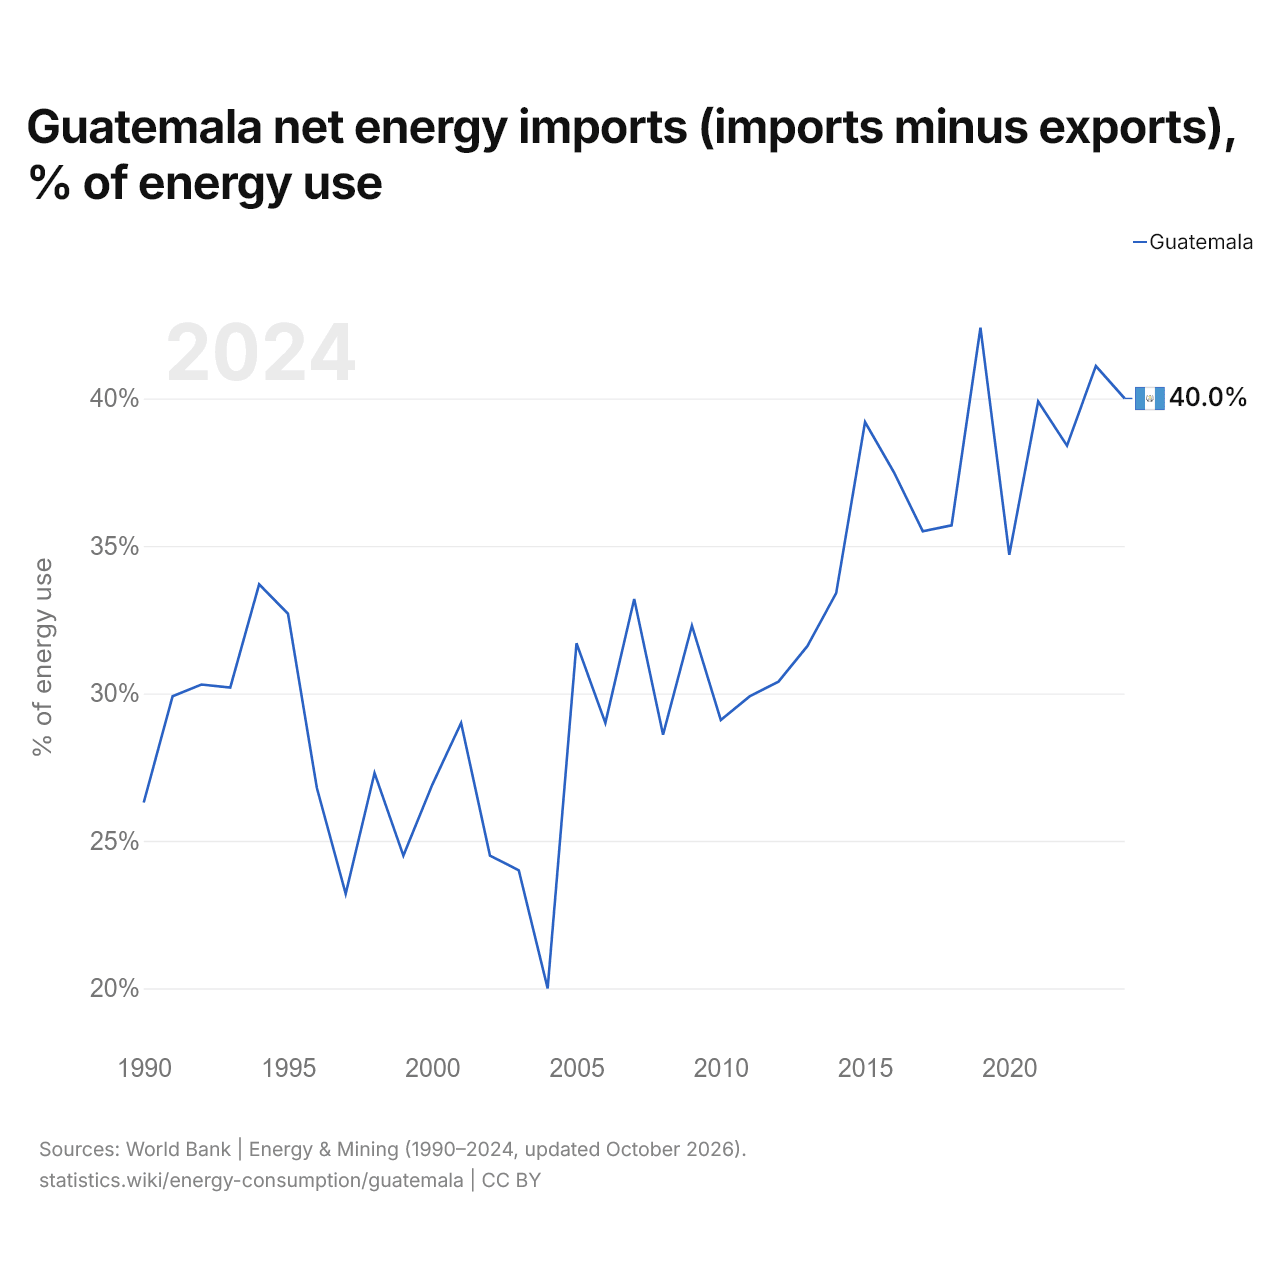
Guatemala's net energy imports equal 40.0% of its energy use; in 1990, its net imports equaled 26.3%.
Guatemala in the world energy consumption ranking
| Rank | Country | TWh | kWh per person | |
|---|---|---|---|---|
| 71 |
 Sudan |
210 | 4,170 | |
| 72 |
 Azerbaijan |
206 | 20,142 | |
| 73 |
 Zambia |
201 | 9,449 | |
| 74 |
 Guatemala |
201 | 10,933 | |
| 75 |
 Ecuador |
195 | 10,779 | vs Ecuador |
| 76 |
 Bulgaria |
195 | 30,332 | |
| 77 |
 Angola |
187 | 4,933 |
Compare the energy consumption of Guatemala with other countries
Sources:
- World Bank | Energy & Mining (1971–2024, updated October 2026)
Creative Commons Attribution (CC BY): you may copy, share, adapt and reuse this content, also commercially, as long as you credit statistics.wiki and note any changes you made. The sources listed above may have their own license terms.