
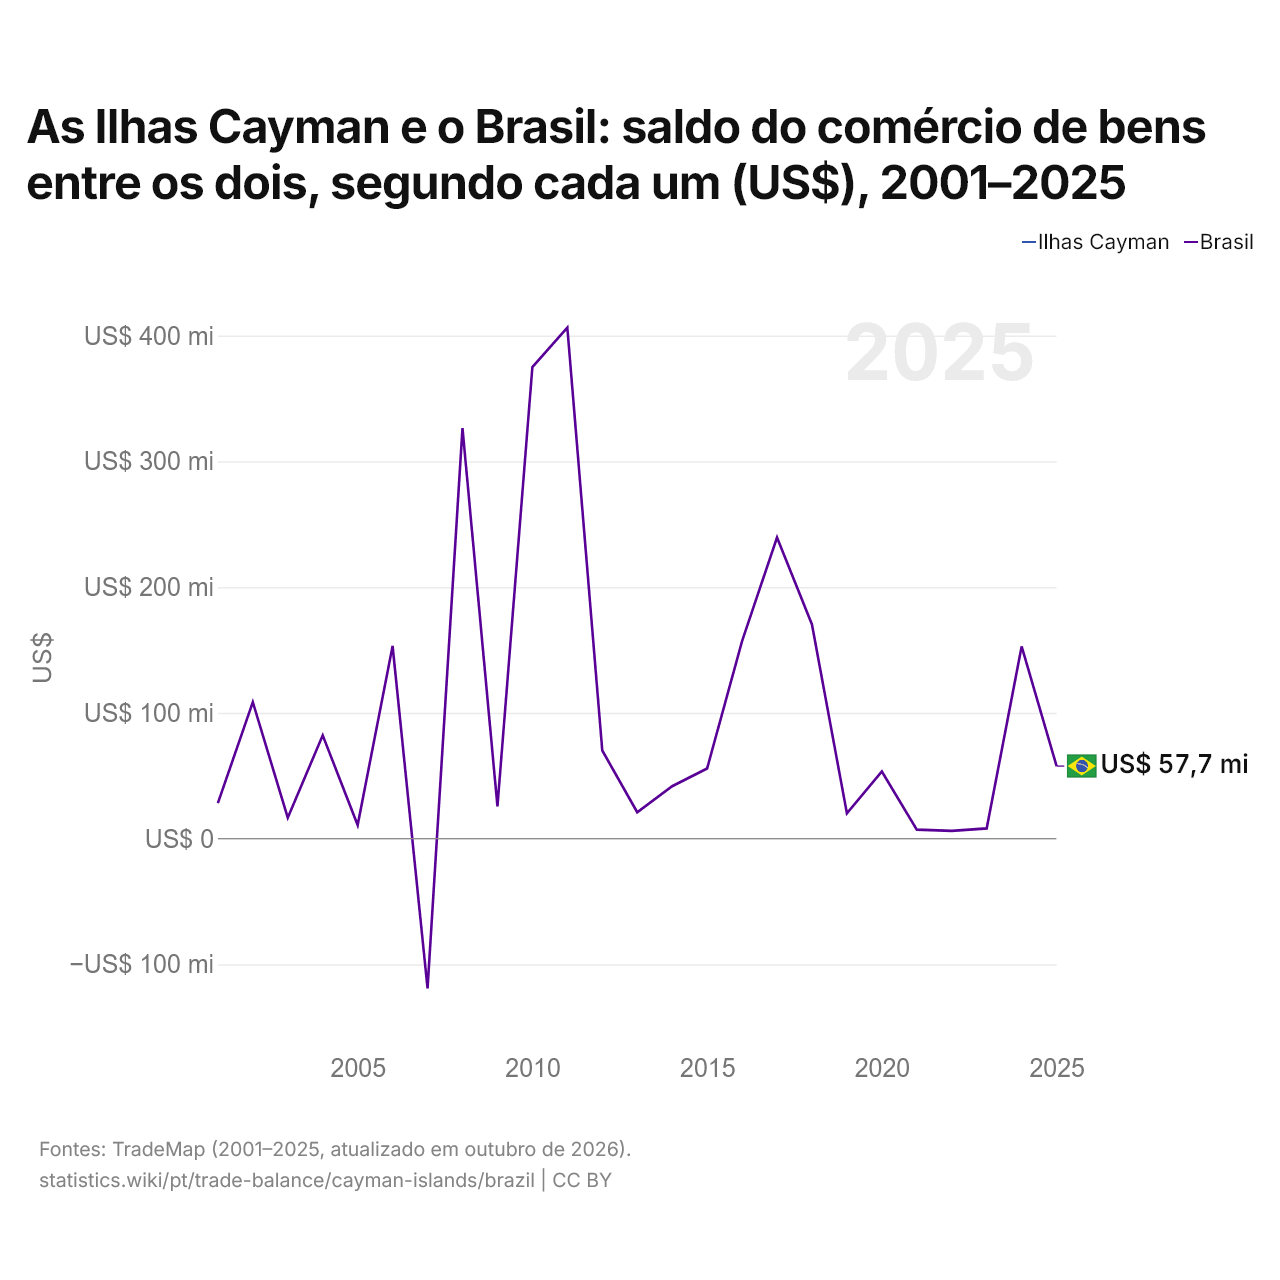
As Ilhas Cayman e o Brasil: saldo do comércio de bens entre os dois, segundo cada um (US$), 2001–2025
1x
| Ano | US$ | |
|---|---|---|
| Ilhas Cayman | Brasil | |
| 2025 | - | US$ 57.669.000 |
| 2024 | - | US$ 152.807.000 |
| 2023 | - | US$ 8.115.000 |
| 2022 | - | US$ 6.103.000 |
| 2021 | - | US$ 7.079.000 |
| 2020 | - | US$ 53.372.000 |
| 2019 | - | US$ 20.053.000 |
| 2018 | - | US$ 170.262.000 |
| 2017 | - | US$ 239.385.000 |
| 2016 | - | US$ 157.091.000 |
| 2015 | - | US$ 55.748.000 |
| 2014 | - | US$ 41.653.000 |
| 2013 | - | US$ 20.933.000 |
| 2012 | - | US$ 70.034.000 |
| 2011 | - | US$ 406.292.000 |
| 2010 | - | US$ 375.028.000 |
| 2009 | - | US$ 25.564.000 |
| 2008 | - | US$ 326.411.000 |
| 2007 | - | US$ −119.064.000 |
| 2006 | - | US$ 153.170.000 |
| 2005 | - | US$ 10.763.000 |
| 2004 | - | US$ 82.115.000 |
| 2003 | - | US$ 16.613.000 |
| 2002 | - | US$ 108.486.000 |
| 2001 | - | US$ 28.178.000 |
Segundo o Brasil, seu comércio de bens com as Ilhas Cayman teve um superávit de US$ 57,7 milhões em 2025, ante um superávit de US$ 28,2 milhões em 2001.
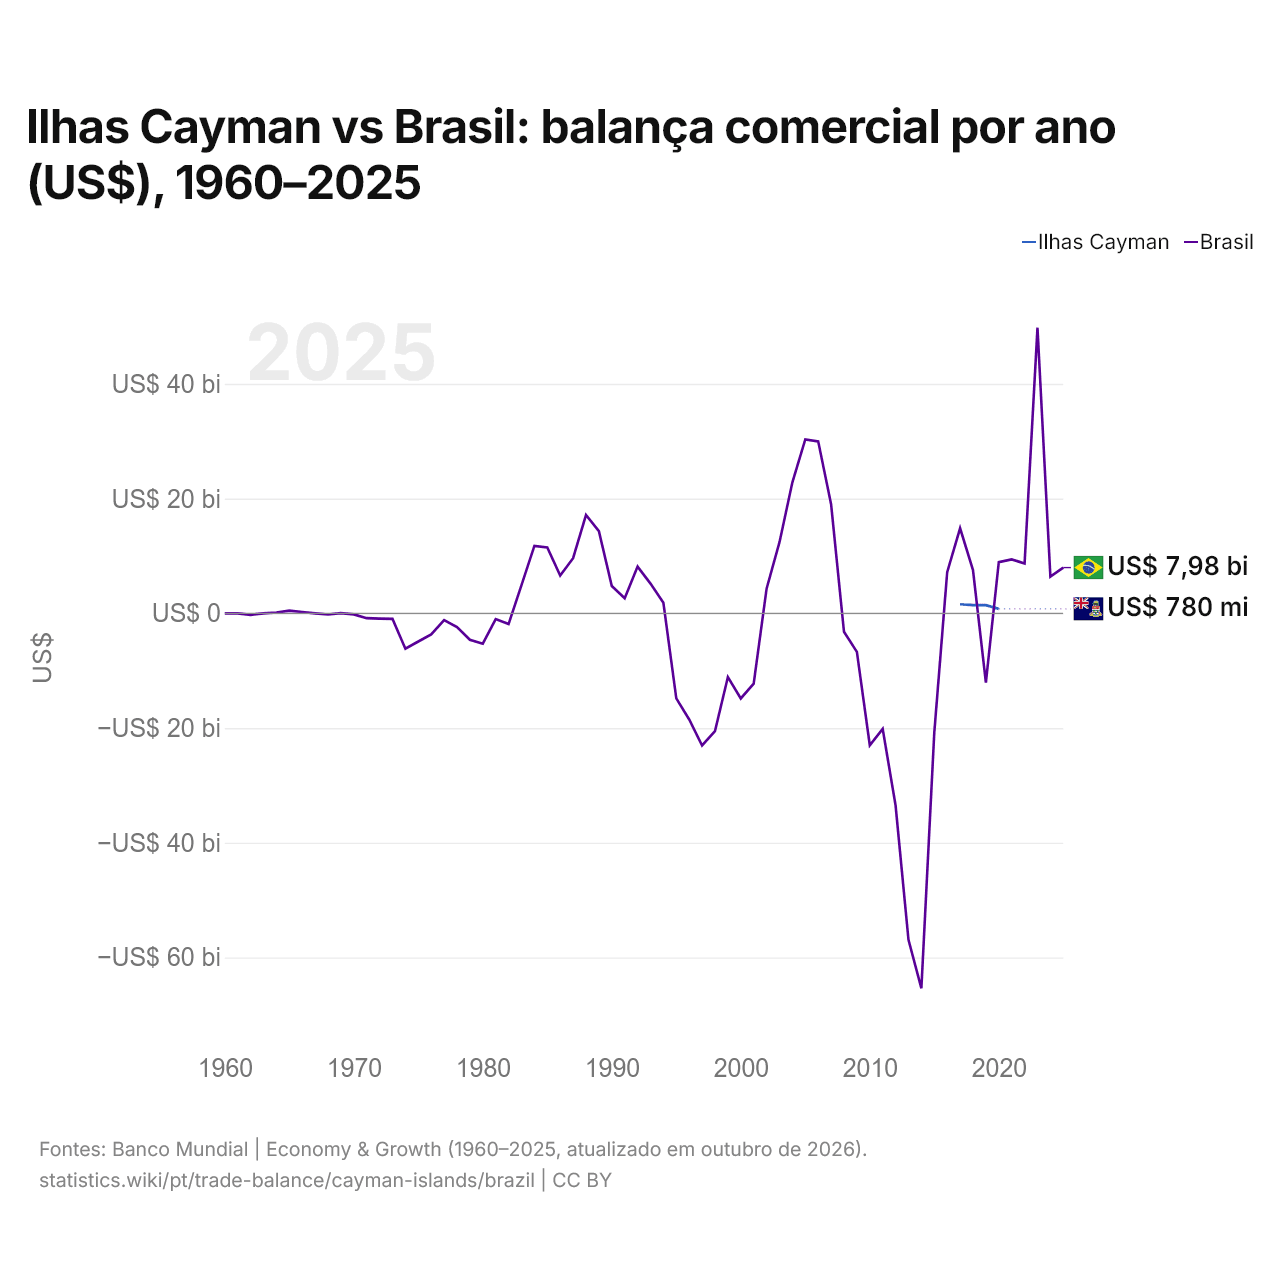
Ilhas Cayman vs Brasil: balança comercial por ano (US$), 1960–2025
1x
| Ano | US$ | |
|---|---|---|
 Ilhas Cayman |
 Brasil |
|
| 2025 | - | US$ 7.978.888.856 |
| 2024 | - | US$ 6.396.477.783 |
| 2023 | - | US$ 49.791.689.659 |
| 2022 | - | US$ 8.695.119.065 |
| 2021 | - | US$ 9.397.892.444 |
| 2020 | US$ 780.123.120 | US$ 8.930.824.788 |
| 2019 | US$ 1.432.205.729 | US$ −12.071.834.246 |
| 2018 | US$ 1.441.085.764 | US$ 7.548.801.626 |
| 2017 | US$ 1.581.246.325 | US$ 14.820.192.744 |
| 2016 | - | US$ 7.176.956.033 |
| 2015 | - | US$ −20.783.887.933 |
| 2014 | - | US$ −65.368.099.307 |
| 2013 | - | US$ −56.911.843.574 |
| 2012 | - | US$ −33.507.264.618 |
| 2011 | - | US$ −20.128.178.015 |
| 2010 | - | US$ −22.994.190.062 |
| 2009 | - | US$ −6.721.885.359 |
| 2008 | - | US$ −3.214.805.207 |
| 2007 | - | US$ 19.039.021.642 |
| 2006 | - | US$ 29.982.705.221 |
| 2005 | - | US$ 30.323.248.288 |
| 2004 | - | US$ 22.844.658.798 |
| 2003 | - | US$ 12.399.391.352 |
| 2002 | - | US$ 4.296.672.537 |
| 2001 | - | US$ −12.279.677.754 |
| 2000 | - | US$ −14.837.154.502 |
| 1999 | - | US$ −11.107.588.704 |
| 1998 | - | US$ −20.535.451.010 |
| 1997 | - | US$ −23.042.055.321 |
| 1996 | - | US$ −18.498.238.583 |
| 1995 | - | US$ −14.822.816.229 |
| 1994 | - | US$ 1.846.111.837 |
| 1993 | - | US$ 5.182.689.343 |
| 1992 | - | US$ 8.149.820.789 |
| 1991 | - | US$ 2.614.204.545 |
| 1990 | - | US$ 4.769.166.667 |
| 1989 | - | US$ 14.323.932.823 |
| 1988 | - | US$ 17.141.241.475 |
| 1987 | - | US$ 9.608.553.171 |
| 1986 | - | US$ 6.601.570.908 |
| 1985 | - | US$ 11.487.450.960 |
| 1984 | - | US$ 11.753.827.696 |
| 1983 | - | US$ 4.906.714.630 |
| 1982 | - | US$ −1.872.613.598 |
| 1981 | - | US$ −999.146.350 |
| 1980 | - | US$ −5.295.341.312 |
| 1979 | - | US$ −4.615.615.400 |
| 1978 | - | US$ −2.387.152.106 |
| 1977 | - | US$ −1.172.207.021 |
| 1976 | - | US$ −3.659.545.985 |
| 1975 | - | US$ −4.907.560.236 |
| 1974 | - | US$ −6.172.123.572 |
| 1973 | - | US$ −975.055.647 |
| 1972 | - | US$ −927.784.676 |
| 1971 | - | US$ −848.612.874 |
| 1970 | - | US$ −177.912.553 |
| 1969 | - | US$ 24.981.601 |
| 1968 | - | US$ −206.594.912 |
| 1967 | - | US$ 0 |
| 1966 | - | US$ 225.450.250 |
| 1965 | - | US$ 474.987.148 |
| 1964 | - | US$ 150.139.739 |
| 1963 | - | US$ −17.161.539 |
| 1962 | - | US$ −263.069.676 |
| 1961 | - | US$ −9.149.903 |
| 1960 | - | US$ −8.829.343 |
A balança comercial das Ilhas Cayman tem um superávit de US$ 780 milhões (2020), e a do Brasil, um superávit de US$ 7,98 bilhões (2025).
Ilhas Cayman vs Brasil: dados da balança comercial
|
Ilhas Cayman
|
Brasil
|
|
|---|---|---|
| Bens e serviços, US$ | +US$ 780 mi (2020) | +US$ 7,98 bi (2025) |
| % do PIB | +13,8% (2020) | +0,3% (2025) |
| Anos com superávit desde 2000 | 4 de 4 | 15 de 26 |
| Saldo de bens entre os dois, dados próprios | n/d | +US$ 57,7 mi (2025) |
| Maior superávit em bens com | n/d | China (+US$ 29,1 bi, 2025) |
| Maior déficit em bens com | Estados Unidos (-US$ 1,31 bi, 2024) | Estados Unidos (-US$ 7,94 bi, 2025) |
Comparar a balança comercial de 2 países quaisquer
Fontes:
- Banco Mundial | Economy & Growth (1960–2025, atualizado em outubro de 2026)
- TradeMap (2001–2025, atualizado em outubro de 2026)
Creative Commons Atribuição (CC BY): você pode copiar, compartilhar, adaptar e reutilizar este conteúdo, inclusive para fins comerciais, desde que cite o statistics.wiki e indique as alterações que fizer. As fontes listadas acima podem ter suas próprias condições de licença.