
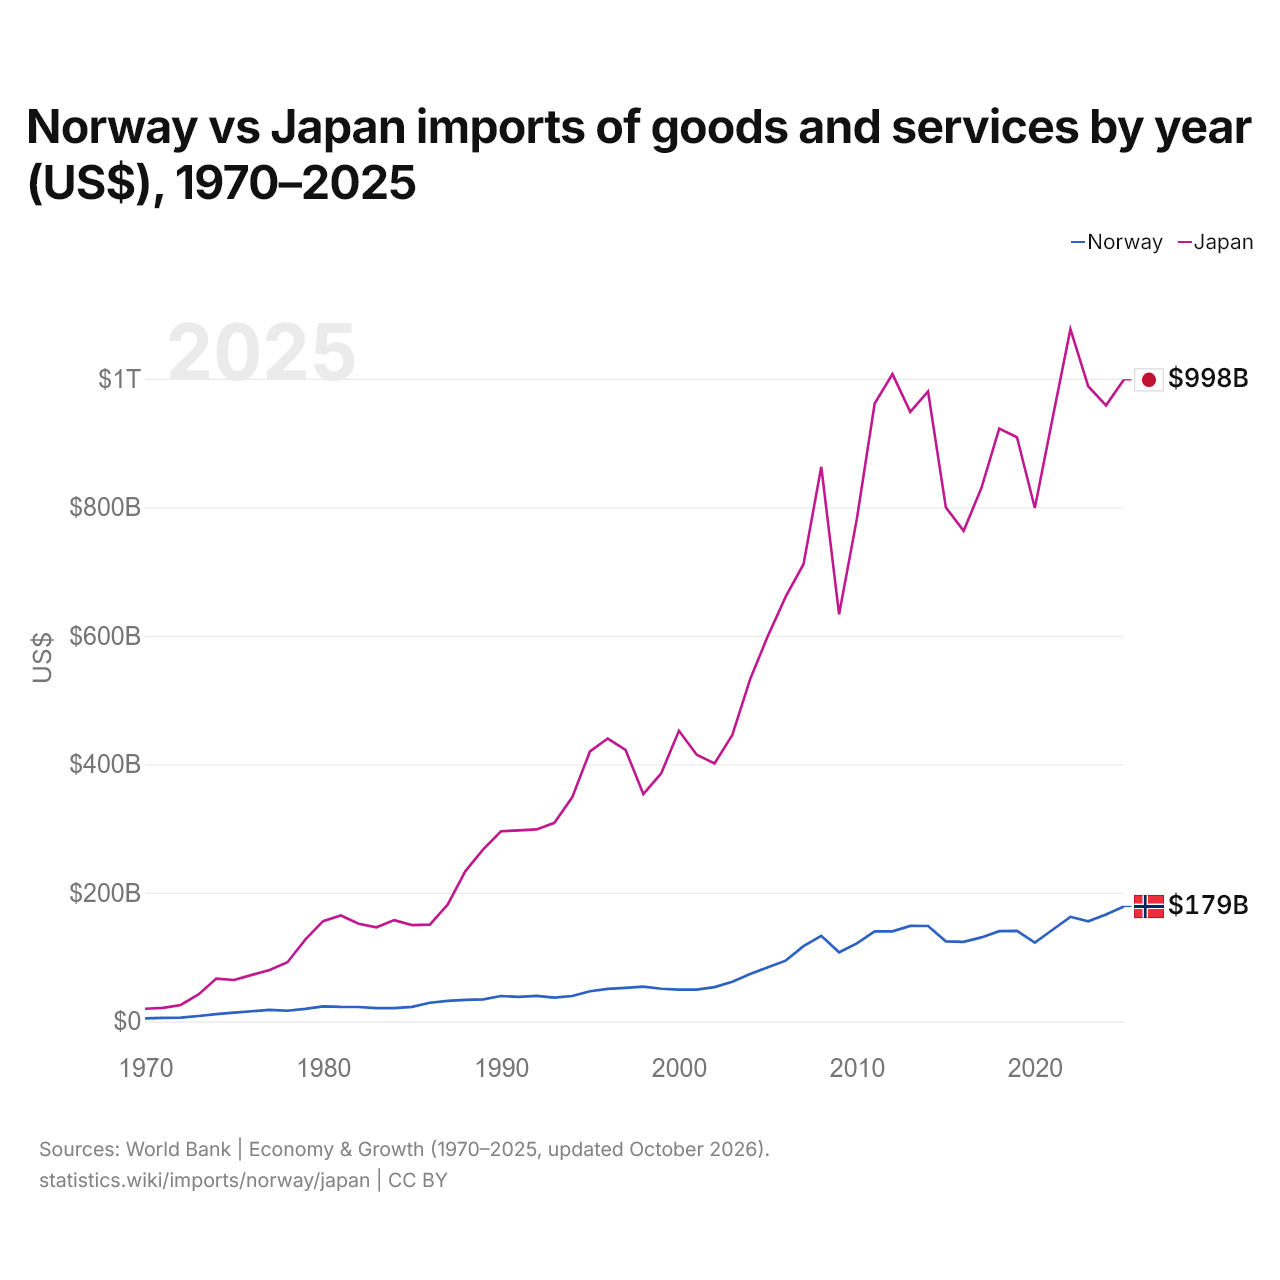
Noruega vs Japão: importações de bens e serviços por ano (US$), 1970–2025
1x
| Ano | US$ | |
|---|---|---|
 Noruega |
 Japão |
|
| 2025 | US$ 178.757.867.735 | US$ 998.125.889.632 |
| 2024 | US$ 166.294.967.041 | US$ 958.381.808.469 |
| 2023 | US$ 155.662.322.499 | US$ 988.160.815.442 |
| 2022 | US$ 162.615.237.930 | US$ 1.076.977.967.309 |
| 2021 | US$ 142.506.169.965 | US$ 938.755.726.387 |
| 2020 | US$ 122.400.955.837 | US$ 798.645.128.767 |
| 2019 | US$ 140.786.477.273 | US$ 908.590.987.611 |
| 2018 | US$ 140.351.306.486 | US$ 922.228.472.389 |
| 2017 | US$ 130.586.741.890 | US$ 829.948.316.864 |
| 2016 | US$ 123.627.857.143 | US$ 763.174.802.439 |
| 2015 | US$ 124.430.215.976 | US$ 799.671.850.412 |
| 2014 | US$ 148.384.554.351 | US$ 980.024.678.768 |
| 2013 | US$ 148.563.574.468 | US$ 948.362.884.512 |
| 2012 | US$ 140.031.800.602 | US$ 1.007.099.152.148 |
| 2011 | US$ 140.044.066.790 | US$ 961.182.364.174 |
| 2010 | US$ 121.186.433.200 | US$ 782.080.174.983 |
| 2009 | US$ 107.374.966.207 | US$ 633.184.104.751 |
| 2008 | US$ 133.117.375.887 | US$ 862.718.956.651 |
| 2007 | US$ 116.943.207.602 | US$ 711.118.565.478 |
| 2006 | US$ 94.422.528.184 | US$ 660.752.902.210 |
| 2005 | US$ 84.100.116.414 | US$ 599.781.161.369 |
| 2004 | US$ 73.465.612.390 | US$ 532.277.504.090 |
| 2003 | US$ 61.430.185.588 | US$ 445.643.407.643 |
| 2002 | US$ 53.263.859.315 | US$ 401.205.059.495 |
| 2001 | US$ 49.300.688.413 | US$ 414.845.357.771 |
| 2000 | US$ 49.390.351.973 | US$ 452.064.900.177 |
| 1999 | US$ 50.711.355.011 | US$ 385.717.972.939 |
| 1998 | US$ 53.951.703.755 | US$ 353.663.297.055 |
| 1997 | US$ 51.975.711.822 | US$ 422.282.171.634 |
| 1996 | US$ 50.577.847.375 | US$ 440.058.798.060 |
| 1995 | US$ 46.902.860.210 | US$ 420.000.722.946 |
| 1994 | US$ 39.487.927.908 | US$ 348.440.138.620 |
| 1993 | US$ 36.998.491.704 | US$ 308.939.565.351 |
| 1992 | US$ 39.601.576.957 | US$ 298.544.112.852 |
| 1991 | US$ 37.991.485.292 | US$ 297.072.083.274 |
| 1990 | US$ 39.350.288.352 | US$ 295.830.930.469 |
| 1989 | US$ 34.262.147.875 | US$ 267.623.386.903 |
| 1988 | US$ 33.341.875.096 | US$ 233.782.306.438 |
| 1987 | US$ 31.858.998.145 | US$ 181.576.008.988 |
| 1986 | US$ 28.933.830.987 | US$ 150.490.328.139 |
| 1985 | US$ 22.524.426.557 | US$ 149.721.341.618 |
| 1984 | US$ 20.556.637.873 | US$ 157.511.814.670 |
| 1983 | US$ 20.498.190.889 | US$ 146.249.637.386 |
| 1982 | US$ 22.348.930.896 | US$ 151.713.508.329 |
| 1981 | US$ 22.370.938.235 | US$ 164.658.527.096 |
| 1980 | US$ 23.373.825.721 | US$ 155.866.963.511 |
| 1979 | US$ 19.388.242.728 | US$ 127.175.652.405 |
| 1978 | US$ 16.468.344.047 | US$ 91.906.326.826 |
| 1977 | US$ 17.753.169.907 | US$ 79.894.824.196 |
| 1976 | US$ 15.703.656.190 | US$ 72.270.446.349 |
| 1975 | US$ 13.537.852.264 | US$ 64.302.596.002 |
| 1974 | US$ 11.282.379.912 | US$ 66.503.972.919 |
| 1973 | US$ 8.308.127.233 | US$ 41.807.597.571 |
| 1972 | US$ 5.766.521.964 | US$ 25.436.329.222 |
| 1971 | US$ 5.285.222.296 | US$ 20.867.004.112 |
| 1970 | US$ 4.599.672.402 | US$ 19.572.635.781 |
Em 2025, as importações de bens e serviços da Noruega foram de US$ 179 bilhões e as do Japão, de US$ 998 bilhões: as do Japão foram 5,6 vezes maiores. Em 1970, as importações do Japão foram 4,3 vezes maiores: US$ 4,6 bilhões da Noruega e US$ 19,6 bilhões do Japão.
As importações de bens e serviços do Japão têm sido maiores que as da Noruega todos os anos desde 1970.
Noruega vs Japão: dados de importações
|
Noruega
|
Japão
|
|
|---|---|---|
| Importações | US$ 179 bi (2025) | US$ 998 bi (2025) |
| Posição mundial | 35/174 | 6/174 |
| Participação mundial | 0,53% | 2,96% |
| % do PIB | 33,7% | 22,5% |
| Maior categoria de bens | Máquinas, eletrônicos e veículos (42%, 2025) | Máquinas, eletrônicos e veículos (34,1%, 2025) |
| Principal origem dos bens | China (11,9%, 2025) | China (23,6%, 2025) |
Comparar as importações de 2 países quaisquer
Fontes:
- Banco Mundial | Economy & Growth (1970–2025, atualizado em outubro de 2026)
- TradeMap (2001–2025, atualizado em outubro de 2026)
Creative Commons Atribuição (CC BY): você pode copiar, compartilhar, adaptar e reutilizar este conteúdo, inclusive para fins comerciais, desde que cite o statistics.wiki e indique as alterações que fizer. As fontes listadas acima podem ter suas próprias condições de licença.