
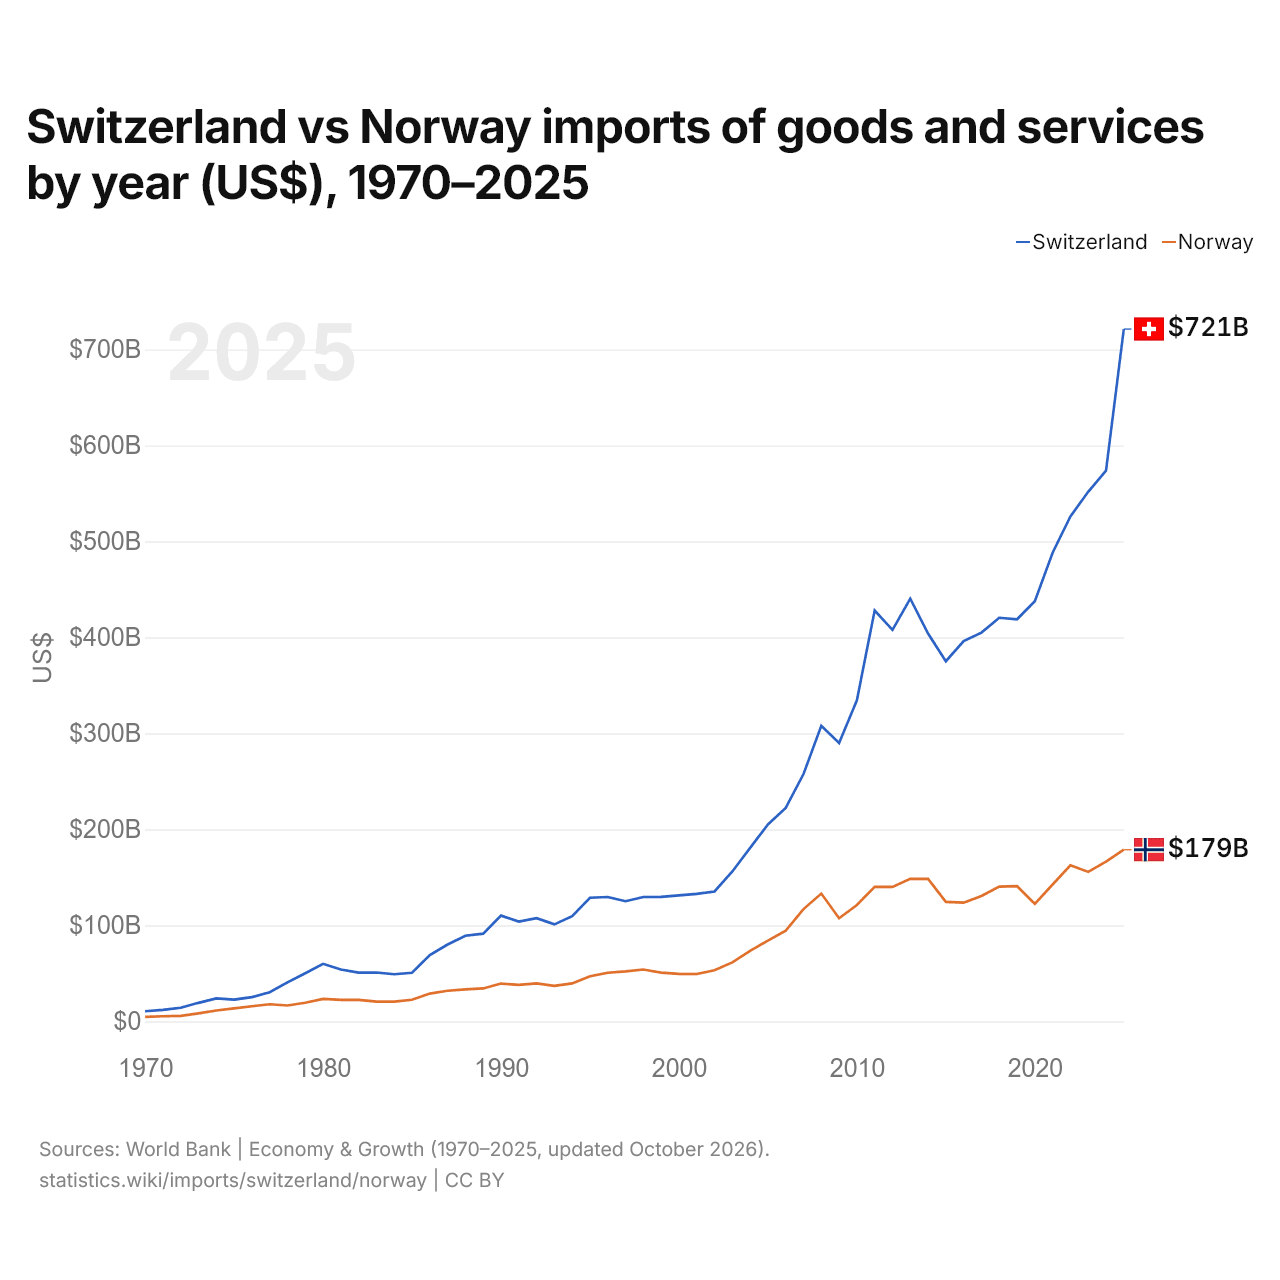
Suíça vs Noruega: importações de bens e serviços por ano (US$), 1970–2025
1x
| Ano | US$ | |
|---|---|---|
 Suíça |
 Noruega |
|
| 2025 | US$ 721.176.290.537 | US$ 178.757.867.735 |
| 2024 | US$ 573.729.148.940 | US$ 166.294.967.041 |
| 2023 | US$ 551.661.909.426 | US$ 155.662.322.499 |
| 2022 | US$ 525.998.490.835 | US$ 162.615.237.930 |
| 2021 | US$ 488.132.942.920 | US$ 142.506.169.965 |
| 2020 | US$ 437.650.198.738 | US$ 122.400.955.837 |
| 2019 | US$ 418.811.907.122 | US$ 140.786.477.273 |
| 2018 | US$ 420.425.133.537 | US$ 140.351.306.486 |
| 2017 | US$ 404.959.093.794 | US$ 130.586.741.890 |
| 2016 | US$ 396.141.657.878 | US$ 123.627.857.143 |
| 2015 | US$ 375.100.653.447 | US$ 124.430.215.976 |
| 2014 | US$ 403.927.913.522 | US$ 148.384.554.351 |
| 2013 | US$ 440.317.765.518 | US$ 148.563.574.468 |
| 2012 | US$ 407.820.712.475 | US$ 140.031.800.602 |
| 2011 | US$ 427.943.351.691 | US$ 140.044.066.790 |
| 2010 | US$ 334.500.366.766 | US$ 121.186.433.200 |
| 2009 | US$ 290.018.359.526 | US$ 107.374.966.207 |
| 2008 | US$ 307.852.346.967 | US$ 133.117.375.887 |
| 2007 | US$ 257.607.392.536 | US$ 116.943.207.602 |
| 2006 | US$ 222.300.672.356 | US$ 94.422.528.184 |
| 2005 | US$ 205.029.812.078 | US$ 84.100.116.414 |
| 2004 | US$ 180.727.030.961 | US$ 73.465.612.390 |
| 2003 | US$ 156.102.130.393 | US$ 61.430.185.588 |
| 2002 | US$ 135.300.341.332 | US$ 53.263.859.315 |
| 2001 | US$ 132.832.664.138 | US$ 49.300.688.413 |
| 2000 | US$ 131.281.286.120 | US$ 49.390.351.973 |
| 1999 | US$ 129.599.304.354 | US$ 50.711.355.011 |
| 1998 | US$ 129.511.621.603 | US$ 53.951.703.755 |
| 1997 | US$ 125.124.828.085 | US$ 51.975.711.822 |
| 1996 | US$ 129.506.317.961 | US$ 50.577.847.375 |
| 1995 | US$ 128.714.580.973 | US$ 46.902.860.210 |
| 1994 | US$ 109.511.724.793 | US$ 39.487.927.908 |
| 1993 | US$ 101.024.191.256 | US$ 36.998.491.704 |
| 1992 | US$ 107.520.864.031 | US$ 39.601.576.957 |
| 1991 | US$ 103.983.464.435 | US$ 37.991.485.292 |
| 1990 | US$ 110.110.583.069 | US$ 39.350.288.352 |
| 1989 | US$ 91.379.329.421 | US$ 34.262.147.875 |
| 1988 | US$ 89.230.436.684 | US$ 33.341.875.096 |
| 1987 | US$ 80.053.582.350 | US$ 31.858.998.145 |
| 1986 | US$ 69.088.170.549 | US$ 28.933.830.987 |
| 1985 | US$ 50.532.659.232 | US$ 22.524.426.557 |
| 1984 | US$ 49.032.176.022 | US$ 20.556.637.873 |
| 1983 | US$ 50.913.370.492 | US$ 20.498.190.889 |
| 1982 | US$ 50.763.085.258 | US$ 22.348.930.896 |
| 1981 | US$ 53.940.970.879 | US$ 22.370.938.235 |
| 1980 | US$ 59.924.576.595 | US$ 23.373.825.721 |
| 1979 | US$ 50.038.490.407 | US$ 19.388.242.728 |
| 1978 | US$ 40.550.611.857 | US$ 16.468.344.047 |
| 1977 | US$ 30.263.671.313 | US$ 17.753.169.907 |
| 1976 | US$ 25.190.649.704 | US$ 15.703.656.190 |
| 1975 | US$ 22.703.224.732 | US$ 13.537.852.264 |
| 1974 | US$ 23.906.117.544 | US$ 11.282.379.912 |
| 1973 | US$ 19.273.720.614 | US$ 8.308.127.233 |
| 1972 | US$ 14.111.769.434 | US$ 5.766.521.964 |
| 1971 | US$ 11.915.190.982 | US$ 5.285.222.296 |
| 1970 | US$ 10.461.910.130 | US$ 4.599.672.402 |
Em 2025, as importações de bens e serviços da Suíça foram de US$ 721 bilhões e as da Noruega, de US$ 179 bilhões: as da Suíça foram 4,0 vezes maiores. Em 1970, as importações da Suíça foram 2,3 vezes maiores: US$ 10,5 bilhões da Suíça e US$ 4,6 bilhões da Noruega.
As importações de bens e serviços da Suíça têm sido maiores que as da Noruega todos os anos desde 1970.
Suíça vs Noruega: dados de importações
|
Suíça
|
Noruega
|
|
|---|---|---|
| Importações | US$ 721 bi (2025) | US$ 179 bi (2025) |
| Posição mundial | 14/174 | 35/174 |
| Participação mundial | 2,14% | 0,53% |
| % do PIB | 69,1% | 33,7% |
| Maior categoria de bens | Metais preciosos, pedras preciosas, joias, relógios, instrumentos musicais e arte (48%, 2025) | Máquinas, eletrônicos e veículos (42%, 2025) |
| Principal origem dos bens | Alemanha (15,1%, 2025) | China (11,9%, 2025) |
Comparar as importações de 2 países quaisquer
Fontes:
- Banco Mundial | Economy & Growth (1970–2025, atualizado em outubro de 2026)
- TradeMap (2001–2025, atualizado em outubro de 2026)
Creative Commons Atribuição (CC BY): você pode copiar, compartilhar, adaptar e reutilizar este conteúdo, inclusive para fins comerciais, desde que cite o statistics.wiki e indique as alterações que fizer. As fontes listadas acima podem ter suas próprias condições de licença.