
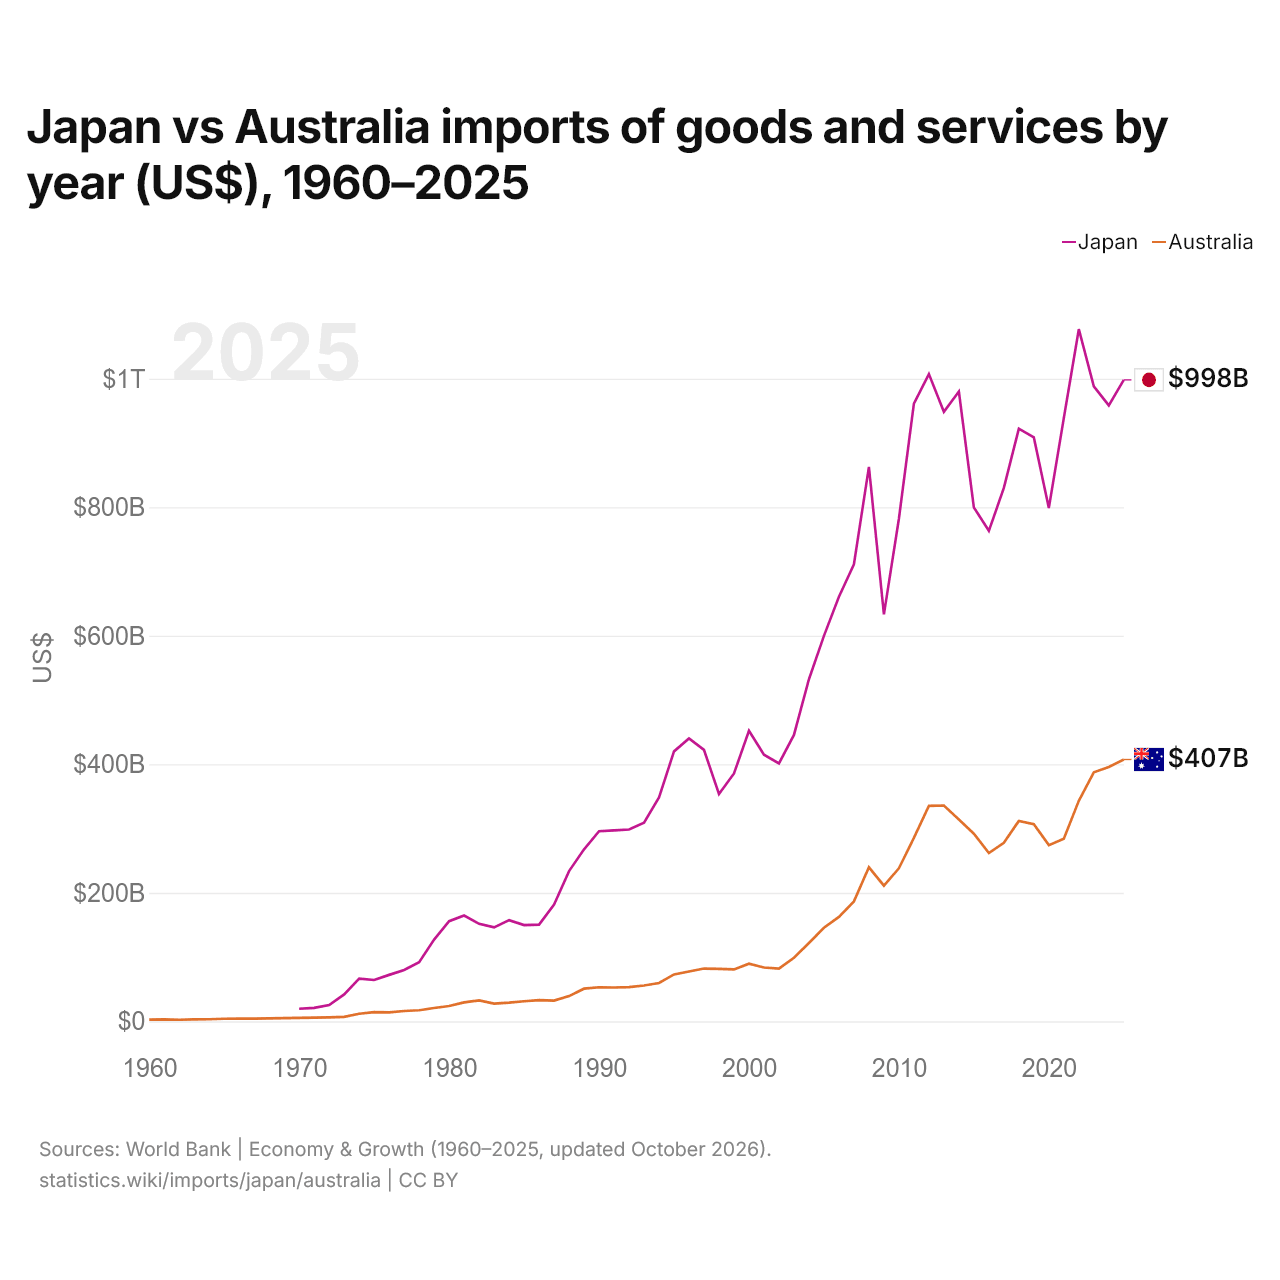
Japão vs Austrália: importações de bens e serviços por ano (US$), 1960–2025
1x
| Ano | US$ | |
|---|---|---|
 Japão |
 Austrália |
|
| 2025 | US$ 998.125.889.632 | US$ 407.490.633.311 |
| 2024 | US$ 958.381.808.469 | US$ 395.749.225.409 |
| 2023 | US$ 988.160.815.442 | US$ 387.533.147.572 |
| 2022 | US$ 1.076.977.967.309 | US$ 343.078.219.088 |
| 2021 | US$ 938.755.726.387 | US$ 284.038.962.018 |
| 2020 | US$ 798.645.128.767 | US$ 274.154.332.727 |
| 2019 | US$ 908.590.987.611 | US$ 306.786.753.626 |
| 2018 | US$ 922.228.472.389 | US$ 311.861.687.285 |
| 2017 | US$ 829.948.316.864 | US$ 277.671.313.150 |
| 2016 | US$ 763.174.802.439 | US$ 261.827.324.556 |
| 2015 | US$ 799.671.850.412 | US$ 291.850.364.122 |
| 2014 | US$ 980.024.678.768 | US$ 314.156.216.979 |
| 2013 | US$ 948.362.884.512 | US$ 335.869.075.673 |
| 2012 | US$ 1.007.099.152.148 | US$ 335.367.853.143 |
| 2011 | US$ 961.182.364.174 | US$ 285.510.760.030 |
| 2010 | US$ 782.080.174.983 | US$ 238.100.480.913 |
| 2009 | US$ 633.184.104.751 | US$ 211.106.497.148 |
| 2008 | US$ 862.718.956.651 | US$ 239.715.332.950 |
| 2007 | US$ 711.118.565.478 | US$ 186.601.240.480 |
| 2006 | US$ 660.752.902.210 | US$ 162.450.827.270 |
| 2005 | US$ 599.781.161.369 | US$ 145.652.868.457 |
| 2004 | US$ 532.277.504.090 | US$ 121.992.459.809 |
| 2003 | US$ 445.643.407.643 | US$ 98.900.407.688 |
| 2002 | US$ 401.205.059.495 | US$ 82.017.039.226 |
| 2001 | US$ 414.845.357.771 | US$ 83.770.437.082 |
| 2000 | US$ 452.064.900.177 | US$ 89.663.284.608 |
| 1999 | US$ 385.717.972.939 | US$ 80.794.585.788 |
| 1998 | US$ 353.663.297.055 | US$ 81.674.014.787 |
| 1997 | US$ 422.282.171.634 | US$ 82.133.225.648 |
| 1996 | US$ 440.058.798.060 | US$ 77.631.200.583 |
| 1995 | US$ 420.000.722.946 | US$ 73.019.750.520 |
| 1994 | US$ 348.440.138.620 | US$ 59.676.236.596 |
| 1993 | US$ 308.939.565.351 | US$ 55.746.908.375 |
| 1992 | US$ 298.544.112.852 | US$ 53.341.618.614 |
| 1991 | US$ 297.072.083.274 | US$ 52.680.239.946 |
| 1990 | US$ 295.830.930.469 | US$ 53.060.646.565 |
| 1989 | US$ 267.623.386.903 | US$ 50.821.263.277 |
| 1988 | US$ 233.782.306.438 | US$ 39.231.436.371 |
| 1987 | US$ 181.576.008.988 | US$ 32.314.716.781 |
| 1986 | US$ 150.490.328.139 | US$ 32.912.702.854 |
| 1985 | US$ 149.721.341.618 | US$ 31.190.673.250 |
| 1984 | US$ 157.511.814.670 | US$ 28.996.243.475 |
| 1983 | US$ 146.249.637.386 | US$ 27.657.830.162 |
| 1982 | US$ 151.713.508.329 | US$ 32.610.614.587 |
| 1981 | US$ 164.658.527.096 | US$ 29.570.416.812 |
| 1980 | US$ 155.866.963.511 | US$ 23.827.298.050 |
| 1979 | US$ 127.175.652.405 | US$ 20.687.265.705 |
| 1978 | US$ 91.906.326.826 | US$ 17.265.414.582 |
| 1977 | US$ 79.894.824.196 | US$ 16.144.757.972 |
| 1976 | US$ 72.270.446.349 | US$ 14.038.081.937 |
| 1975 | US$ 64.302.596.002 | US$ 14.315.171.378 |
| 1974 | US$ 66.503.972.919 | US$ 11.737.656.595 |
| 1973 | US$ 41.807.597.571 | US$ 7.022.421.525 |
| 1972 | US$ 25.436.329.222 | US$ 6.220.794.393 |
| 1971 | US$ 20.867.004.112 | US$ 5.839.680.934 |
| 1970 | US$ 19.572.635.781 | US$ 5.455.520.873 |
| 1969 | - | US$ 4.883.200.781 |
| 1968 | - | US$ 4.730.880.757 |
| 1967 | - | US$ 4.222.400.676 |
| 1966 | - | US$ 4.124.960.660 |
| 1965 | - | US$ 3.959.200.633 |
| 1964 | - | US$ 3.270.400.523 |
| 1963 | - | US$ 2.974.720.476 |
| 1962 | - | US$ 2.512.160.402 |
| 1961 | - | US$ 2.952.320.472 |
| 1960 | - | US$ 2.611.840.418 |
Em 2025, as importações de bens e serviços do Japão foram de US$ 998 bilhões e as da Austrália, de US$ 407 bilhões: as do Japão foram 2,4 vezes maiores. Em 1970, as importações do Japão foram 3,6 vezes maiores: US$ 19,6 bilhões do Japão e US$ 5,46 bilhões da Austrália.
As importações de bens e serviços do Japão têm sido maiores que as da Austrália todos os anos desde 1970.
Japão vs Austrália: dados de importações
|
Japão
|
Austrália
|
|
|---|---|---|
| Importações | US$ 998 bi (2025) | US$ 407 bi (2025) |
| Posição mundial | 6/174 | 22/174 |
| Participação mundial | 2,96% | 1,21% |
| % do PIB | 22,5% | 22,7% |
| Maior categoria de bens | Máquinas, eletrônicos e veículos (34,1%, 2025) | Máquinas, eletrônicos e veículos (45%, 2025) |
| Principal origem dos bens | China (23,6%, 2025) | China (26,6%, 2025) |
Comparar as importações de 2 países quaisquer
Fontes:
- Banco Mundial | Economy & Growth (1960–2025, atualizado em outubro de 2026)
- TradeMap (2001–2025, atualizado em outubro de 2026)
Creative Commons Atribuição (CC BY): você pode copiar, compartilhar, adaptar e reutilizar este conteúdo, inclusive para fins comerciais, desde que cite o statistics.wiki e indique as alterações que fizer. As fontes listadas acima podem ter suas próprias condições de licença.