
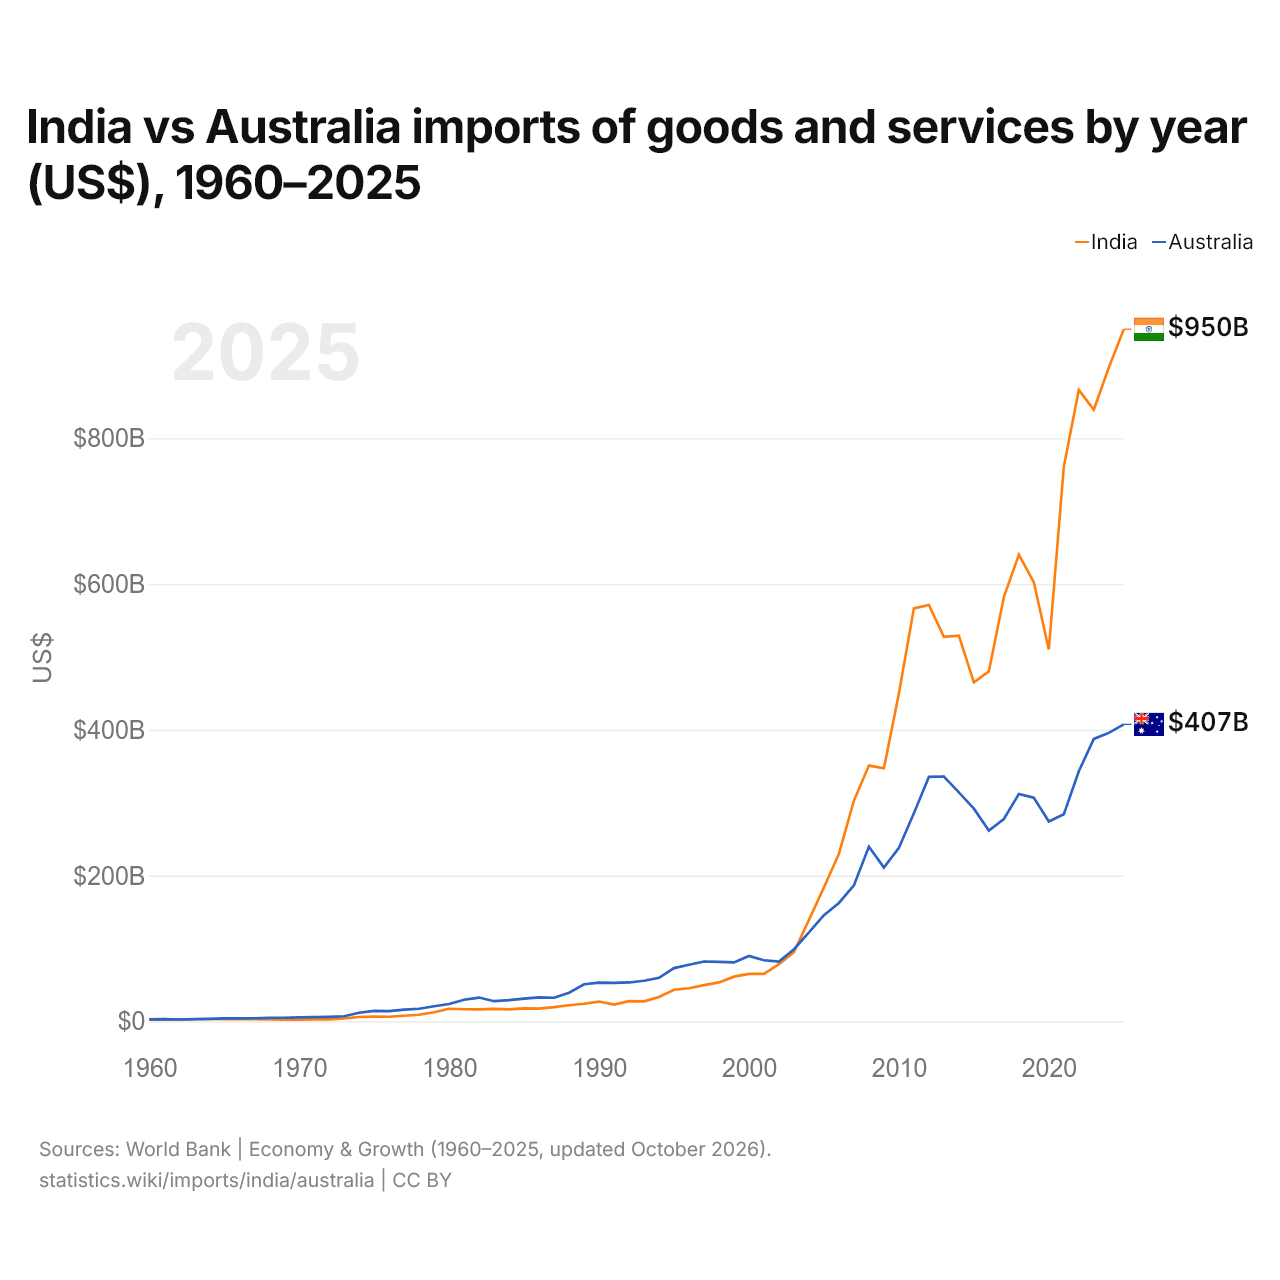
Índia vs Austrália: importações de bens e serviços por ano (US$), 1960–2025
1x
| Ano | US$ | |
|---|---|---|
 Índia |
 Austrália |
|
| 2025 | US$ 949.660.225.776 | US$ 407.490.633.311 |
| 2024 | US$ 897.055.898.132 | US$ 395.749.225.409 |
| 2023 | US$ 839.102.411.987 | US$ 387.533.147.572 |
| 2022 | US$ 866.361.019.119 | US$ 343.078.219.088 |
| 2021 | US$ 760.902.891.806 | US$ 284.038.962.018 |
| 2020 | US$ 510.244.747.372 | US$ 274.154.332.727 |
| 2019 | US$ 602.315.056.053 | US$ 306.786.753.626 |
| 2018 | US$ 640.300.806.739 | US$ 311.861.687.285 |
| 2017 | US$ 582.018.012.522 | US$ 277.671.313.150 |
| 2016 | US$ 480.169.055.768 | US$ 261.827.324.556 |
| 2015 | US$ 465.097.595.426 | US$ 291.850.364.122 |
| 2014 | US$ 529.239.428.329 | US$ 314.156.216.979 |
| 2013 | US$ 527.555.307.106 | US$ 335.869.075.673 |
| 2012 | US$ 571.306.554.042 | US$ 335.367.853.143 |
| 2011 | US$ 566.667.744.820 | US$ 285.510.760.030 |
| 2010 | US$ 449.974.370.199 | US$ 238.100.480.913 |
| 2009 | US$ 347.177.967.968 | US$ 211.106.497.148 |
| 2008 | US$ 350.926.955.799 | US$ 239.715.332.950 |
| 2007 | US$ 302.803.952.553 | US$ 186.601.240.480 |
| 2006 | US$ 229.955.027.127 | US$ 162.450.827.270 |
| 2005 | US$ 183.736.617.243 | US$ 145.652.868.457 |
| 2004 | US$ 139.310.848.797 | US$ 121.992.459.809 |
| 2003 | US$ 95.071.869.379 | US$ 98.900.407.688 |
| 2002 | US$ 78.498.759.286 | US$ 82.017.039.226 |
| 2001 | US$ 65.218.276.482 | US$ 83.770.437.082 |
| 2000 | US$ 65.124.245.375 | US$ 89.663.284.608 |
| 1999 | US$ 61.314.704.757 | US$ 80.794.585.788 |
| 1998 | US$ 53.431.564.328 | US$ 81.674.014.787 |
| 1997 | US$ 49.607.467.421 | US$ 82.133.225.648 |
| 1996 | US$ 45.357.266.003 | US$ 77.631.200.583 |
| 1995 | US$ 43.318.425.768 | US$ 73.019.750.520 |
| 1994 | US$ 33.349.501.148 | US$ 59.676.236.596 |
| 1993 | US$ 27.419.354.119 | US$ 55.746.908.375 |
| 1992 | US$ 27.639.649.994 | US$ 53.341.618.614 |
| 1991 | US$ 22.941.358.805 | US$ 52.680.239.946 |
| 1990 | US$ 27.132.072.318 | US$ 53.060.646.565 |
| 1989 | US$ 24.133.353.522 | US$ 50.821.263.277 |
| 1988 | US$ 22.111.443.193 | US$ 39.231.436.371 |
| 1987 | US$ 19.477.194.741 | US$ 32.314.716.781 |
| 1986 | US$ 17.486.411.450 | US$ 32.912.702.854 |
| 1985 | US$ 17.776.627.208 | US$ 31.190.673.250 |
| 1984 | US$ 16.391.245.675 | US$ 28.996.243.475 |
| 1983 | US$ 17.140.048.793 | US$ 27.657.830.162 |
| 1982 | US$ 16.343.526.469 | US$ 32.610.614.587 |
| 1981 | US$ 16.584.605.960 | US$ 29.570.416.812 |
| 1980 | US$ 17.226.125.073 | US$ 23.827.298.050 |
| 1979 | US$ 12.498.452.242 | US$ 20.687.265.705 |
| 1978 | US$ 9.045.733.047 | US$ 17.265.414.582 |
| 1977 | US$ 7.611.052.224 | US$ 16.144.757.972 |
| 1976 | US$ 6.280.792.834 | US$ 14.038.081.937 |
| 1975 | US$ 6.545.472.951 | US$ 14.315.171.378 |
| 1974 | US$ 5.992.067.751 | US$ 11.737.656.595 |
| 1973 | US$ 4.039.284.329 | US$ 7.022.421.525 |
| 1972 | US$ 2.650.561.669 | US$ 6.220.794.393 |
| 1971 | US$ 2.695.673.511 | US$ 5.839.680.934 |
| 1970 | US$ 2.421.333.333 | US$ 5.455.520.873 |
| 1969 | US$ 2.356.000.000 | US$ 4.883.200.781 |
| 1968 | US$ 2.624.000.000 | US$ 4.730.880.757 |
| 1967 | US$ 2.981.333.333 | US$ 4.222.400.676 |
| 1966 | US$ 3.041.036.962 | US$ 4.124.960.660 |
| 1965 | US$ 3.103.803.104 | US$ 3.959.200.633 |
| 1964 | US$ 3.210.903.211 | US$ 3.270.400.523 |
| 1963 | US$ 2.860.202.860 | US$ 2.974.720.476 |
| 1962 | US$ 2.543.102.543 | US$ 2.512.160.402 |
| 1961 | US$ 2.337.302.337 | US$ 2.952.320.472 |
| 1960 | US$ 2.530.502.531 | US$ 2.611.840.418 |
Em 2025, as importações de bens e serviços da Índia foram de US$ 950 bilhões e as da Austrália, de US$ 407 bilhões: as da Índia foram 2,3 vezes maiores. Em 1960, as importações da Austrália foram 3,2% maiores: US$ 2,53 bilhões da Índia e US$ 2,61 bilhões da Austrália.
As importações de bens e serviços da Índia têm sido maiores que as da Austrália todos os anos desde 2004.
Índia vs Austrália: dados de importações
|
Índia
|
Austrália
|
|
|---|---|---|
| Importações | US$ 950 bi (2025) | US$ 407 bi (2025) |
| Posição mundial | 7/174 | 22/174 |
| Participação mundial | 2,82% | 1,21% |
| % do PIB | 24,0% | 22,7% |
| Maior categoria de bens | Petróleo, gás, minérios e outras matérias-primas (34,4%, 2025) | Máquinas, eletrônicos e veículos (45%, 2025) |
| Principal origem dos bens | China (16,6%, 2025) | China (26,6%, 2025) |
Comparar as importações de 2 países quaisquer
Fontes:
- Banco Mundial | Economy & Growth (1960–2025, atualizado em outubro de 2026)
- TradeMap (2001–2025, atualizado em outubro de 2026)
Creative Commons Atribuição (CC BY): você pode copiar, compartilhar, adaptar e reutilizar este conteúdo, inclusive para fins comerciais, desde que cite o statistics.wiki e indique as alterações que fizer. As fontes listadas acima podem ter suas próprias condições de licença.