
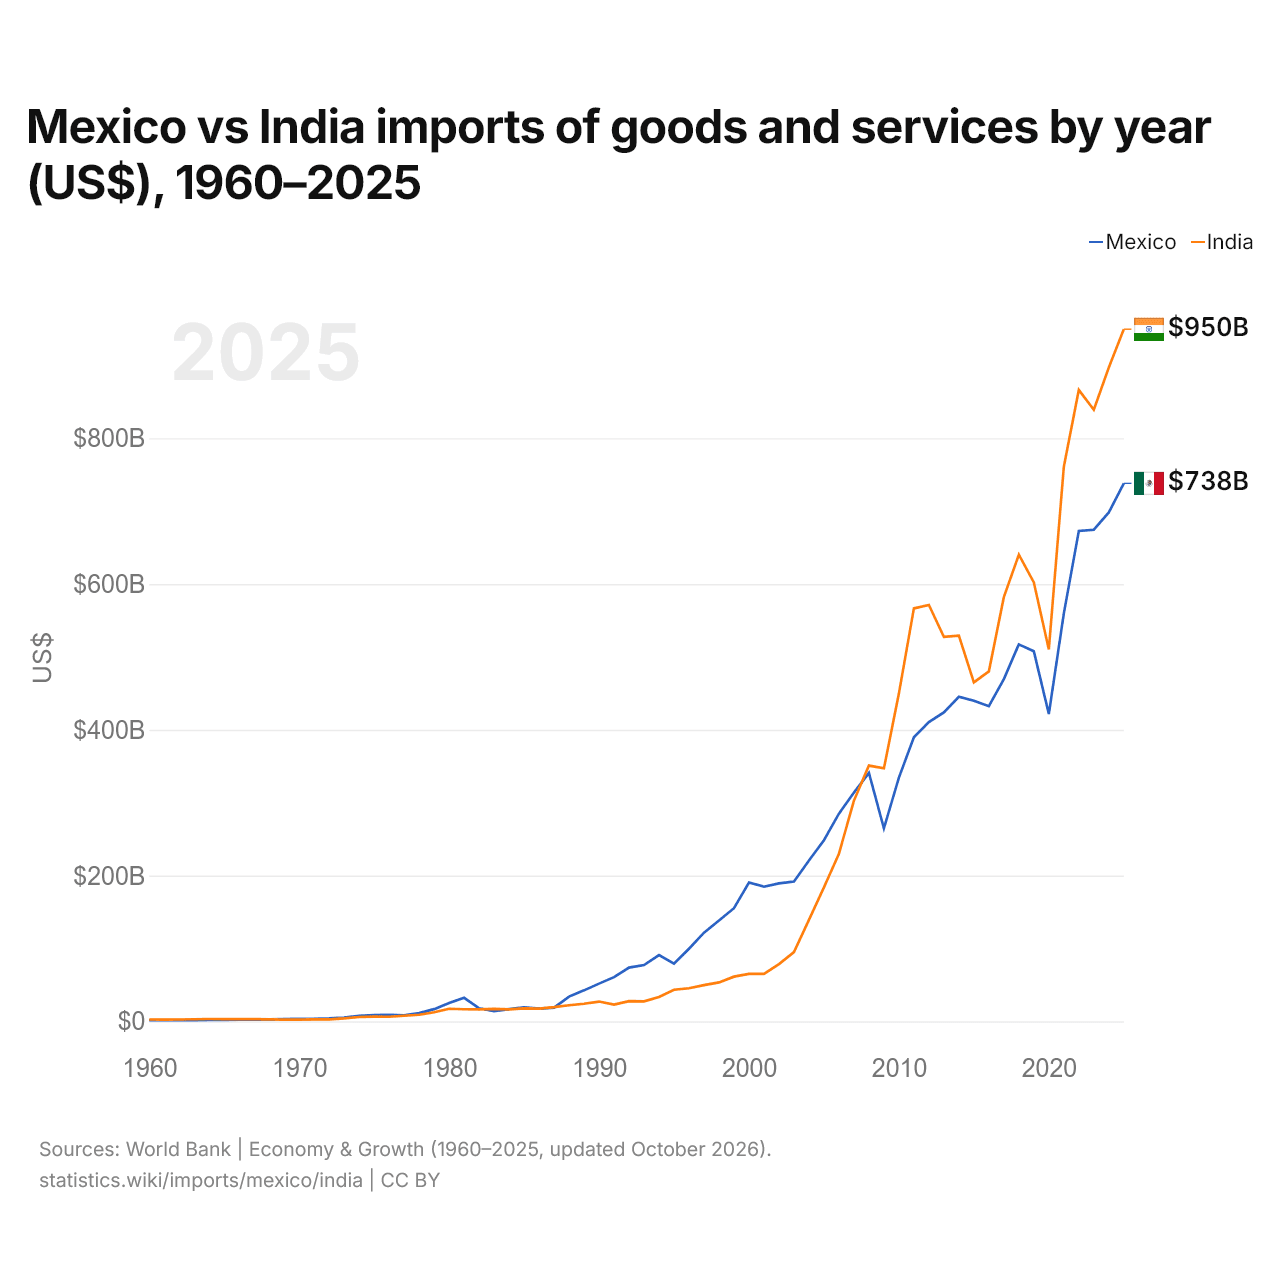
México vs Índia: importações de bens e serviços por ano (US$), 1960–2025
1x
| Ano | US$ | |
|---|---|---|
 México |
 Índia |
|
| 2025 | US$ 738.162.519.127 | US$ 949.660.225.776 |
| 2024 | US$ 698.190.455.616 | US$ 897.055.898.132 |
| 2023 | US$ 674.539.332.149 | US$ 839.102.411.987 |
| 2022 | US$ 672.827.146.644 | US$ 866.361.019.119 |
| 2021 | US$ 559.543.398.298 | US$ 760.902.891.806 |
| 2020 | US$ 421.735.413.259 | US$ 510.244.747.372 |
| 2019 | US$ 507.718.819.550 | US$ 602.315.056.053 |
| 2018 | US$ 517.202.845.543 | US$ 640.300.806.739 |
| 2017 | US$ 469.597.181.246 | US$ 582.018.012.522 |
| 2016 | US$ 432.376.614.132 | US$ 480.169.055.768 |
| 2015 | US$ 439.821.695.268 | US$ 465.097.595.426 |
| 2014 | US$ 445.312.781.391 | US$ 529.239.428.329 |
| 2013 | US$ 423.928.383.607 | US$ 527.555.307.106 |
| 2012 | US$ 410.653.072.131 | US$ 571.306.554.042 |
| 2011 | US$ 389.836.031.336 | US$ 566.667.744.820 |
| 2010 | US$ 334.456.322.123 | US$ 449.974.370.199 |
| 2009 | US$ 264.902.814.265 | US$ 347.177.967.968 |
| 2008 | US$ 340.860.425.741 | US$ 350.926.955.799 |
| 2007 | US$ 313.922.896.029 | US$ 302.803.952.553 |
| 2006 | US$ 284.933.176.454 | US$ 229.955.027.127 |
| 2005 | US$ 248.437.817.057 | US$ 183.736.617.243 |
| 2004 | US$ 220.739.895.660 | US$ 139.310.848.797 |
| 2003 | US$ 191.730.637.234 | US$ 95.071.869.379 |
| 2002 | US$ 189.355.937.339 | US$ 78.498.759.286 |
| 2001 | US$ 184.678.218.802 | US$ 65.218.276.482 |
| 2000 | US$ 190.555.678.047 | US$ 65.124.245.375 |
| 1999 | US$ 155.258.243.956 | US$ 61.314.704.757 |
| 1998 | US$ 138.306.850.713 | US$ 53.431.564.328 |
| 1997 | US$ 121.630.321.174 | US$ 49.607.467.421 |
| 1996 | US$ 99.589.465.577 | US$ 45.357.266.003 |
| 1995 | US$ 79.072.391.842 | US$ 43.318.425.768 |
| 1994 | US$ 90.814.853.233 | US$ 33.349.501.148 |
| 1993 | US$ 77.229.254.751 | US$ 27.419.354.119 |
| 1992 | US$ 73.709.242.760 | US$ 27.639.649.994 |
| 1991 | US$ 60.602.372.094 | US$ 22.941.358.805 |
| 1990 | US$ 51.768.004.611 | US$ 27.132.072.318 |
| 1989 | US$ 42.503.750.803 | US$ 24.133.353.522 |
| 1988 | US$ 33.950.898.441 | US$ 22.111.443.193 |
| 1987 | US$ 18.775.902.765 | US$ 19.477.194.741 |
| 1986 | US$ 17.390.079.327 | US$ 17.486.411.450 |
| 1985 | US$ 19.065.246.504 | US$ 17.776.627.208 |
| 1984 | US$ 16.774.715.780 | US$ 16.391.245.675 |
| 1983 | US$ 14.025.463.387 | US$ 17.140.048.793 |
| 1982 | US$ 17.919.648.239 | US$ 16.343.526.469 |
| 1981 | US$ 32.330.287.579 | US$ 16.584.605.960 |
| 1980 | US$ 25.269.530.739 | US$ 17.226.125.073 |
| 1979 | US$ 16.750.506.468 | US$ 12.498.452.242 |
| 1978 | US$ 11.332.164.976 | US$ 9.045.733.047 |
| 1977 | US$ 8.373.206.929 | US$ 7.611.052.224 |
| 1976 | US$ 8.769.603.267 | US$ 6.280.792.834 |
| 1975 | US$ 8.465.680.000 | US$ 6.545.472.951 |
| 1974 | US$ 7.612.160.000 | US$ 5.992.067.751 |
| 1973 | US$ 5.232.144.000 | US$ 4.039.284.329 |
| 1972 | US$ 3.991.120.000 | US$ 2.650.561.669 |
| 1971 | US$ 3.417.960.000 | US$ 2.695.673.511 |
| 1970 | US$ 3.430.408.000 | US$ 2.421.333.333 |
| 1969 | US$ 3.011.216.000 | US$ 2.356.000.000 |
| 1968 | US$ 2.746.232.000 | US$ 2.624.000.000 |
| 1967 | US$ 2.392.912.000 | US$ 2.981.333.333 |
| 1966 | US$ 2.192.168.000 | US$ 3.041.036.962 |
| 1965 | US$ 2.079.752.000 | US$ 3.103.803.104 |
| 1964 | US$ 1.978.568.000 | US$ 3.210.903.211 |
| 1963 | US$ 1.688.128.000 | US$ 2.860.202.860 |
| 1962 | US$ 1.536.528.000 | US$ 2.543.102.543 |
| 1961 | US$ 1.503.120.000 | US$ 2.337.302.337 |
| 1960 | US$ 1.520.944.000 | US$ 2.530.502.531 |
Em 2025, as importações de bens e serviços do México foram de US$ 738 bilhões e as da Índia, de US$ 950 bilhões: as da Índia foram 29% maiores. Em 1960, as importações da Índia foram 1,7 vezes maiores: US$ 1,52 bilhão do México e US$ 2,53 bilhões da Índia.
As importações de bens e serviços da Índia têm sido maiores que as do México todos os anos desde 2008.
México vs Índia: dados de importações
|
México
|
Índia
|
|
|---|---|---|
| Importações | US$ 738 bi (2025) | US$ 950 bi (2025) |
| Posição mundial | 13/174 | 7/174 |
| Participação mundial | 2,19% | 2,82% |
| % do PIB | 40,3% | 24,0% |
| Maior categoria de bens | Máquinas, eletrônicos e veículos (55,3%, 2025) | Petróleo, gás, minérios e outras matérias-primas (34,4%, 2025) |
| Principal origem dos bens | Estados Unidos (37,7%, 2025) | China (16,6%, 2025) |
Comparar as importações de 2 países quaisquer
Fontes:
- Banco Mundial | Economy & Growth (1960–2025, atualizado em outubro de 2026)
- TradeMap (2001–2025, atualizado em outubro de 2026)
Creative Commons Atribuição (CC BY): você pode copiar, compartilhar, adaptar e reutilizar este conteúdo, inclusive para fins comerciais, desde que cite o statistics.wiki e indique as alterações que fizer. As fontes listadas acima podem ter suas próprias condições de licença.