
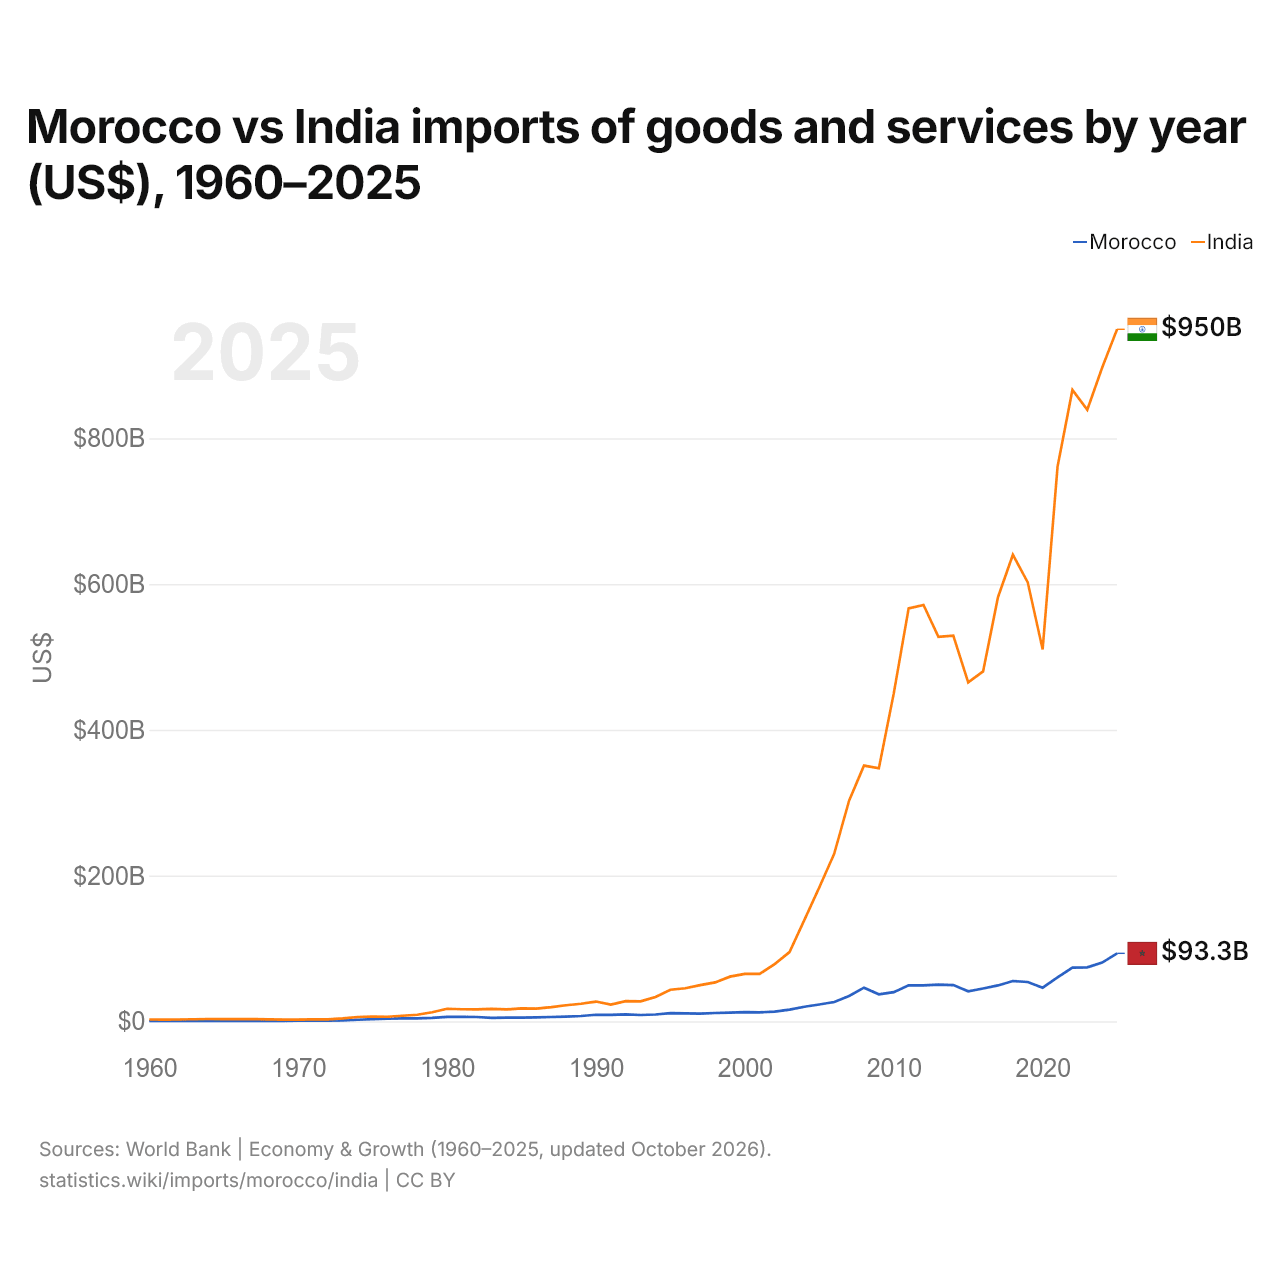
Marrocos vs Índia: importações de bens e serviços por ano (US$), 1960–2025
1x
| Ano | US$ | |
|---|---|---|
 Marrocos |
 Índia |
|
| 2025 | US$ 93.252.409.527 | US$ 949.660.225.776 |
| 2024 | US$ 80.608.604.200 | US$ 897.055.898.132 |
| 2023 | US$ 74.040.709.936 | US$ 839.102.411.987 |
| 2022 | US$ 73.752.886.131 | US$ 866.361.019.119 |
| 2021 | US$ 60.199.361.761 | US$ 760.902.891.806 |
| 2020 | US$ 46.174.693.559 | US$ 510.244.747.372 |
| 2019 | US$ 54.024.112.942 | US$ 602.315.056.053 |
| 2018 | US$ 55.299.739.977 | US$ 640.300.806.739 |
| 2017 | US$ 49.273.637.902 | US$ 582.018.012.522 |
| 2016 | US$ 45.062.154.626 | US$ 480.169.055.768 |
| 2015 | US$ 41.176.430.828 | US$ 465.097.595.426 |
| 2014 | US$ 49.749.730.471 | US$ 529.239.428.329 |
| 2013 | US$ 50.467.526.992 | US$ 527.555.307.106 |
| 2012 | US$ 49.324.878.353 | US$ 571.306.554.042 |
| 2011 | US$ 49.394.706.346 | US$ 566.667.744.820 |
| 2010 | US$ 40.097.025.623 | US$ 449.974.370.199 |
| 2009 | US$ 37.077.112.112 | US$ 347.177.967.968 |
| 2008 | US$ 46.189.159.809 | US$ 350.926.955.799 |
| 2007 | US$ 34.711.235.493 | US$ 302.803.952.553 |
| 2006 | US$ 26.592.143.477 | US$ 229.955.027.127 |
| 2005 | US$ 23.064.213.862 | US$ 183.736.617.243 |
| 2004 | US$ 19.968.080.463 | US$ 139.310.848.797 |
| 2003 | US$ 16.048.236.121 | US$ 95.071.869.379 |
| 2002 | US$ 13.353.797.750 | US$ 78.498.759.286 |
| 2001 | US$ 12.314.903.926 | US$ 65.218.276.482 |
| 2000 | US$ 12.579.800.085 | US$ 65.124.245.375 |
| 1999 | US$ 12.003.458.114 | US$ 61.314.704.757 |
| 1998 | US$ 11.452.325.639 | US$ 53.431.564.328 |
| 1997 | US$ 10.658.406.550 | US$ 49.607.467.421 |
| 1996 | US$ 10.902.426.721 | US$ 45.357.266.003 |
| 1995 | US$ 11.335.099.532 | US$ 43.318.425.768 |
| 1994 | US$ 9.390.609.855 | US$ 33.349.501.148 |
| 1993 | US$ 8.739.349.823 | US$ 27.419.354.119 |
| 1992 | US$ 9.469.830.979 | US$ 27.639.649.994 |
| 1991 | US$ 8.865.788.883 | US$ 22.941.358.805 |
| 1990 | US$ 9.074.317.736 | US$ 27.132.072.318 |
| 1989 | US$ 7.314.302.141 | US$ 24.133.353.522 |
| 1988 | US$ 6.462.582.987 | US$ 22.111.443.193 |
| 1987 | US$ 5.914.964.605 | US$ 19.477.194.741 |
| 1986 | US$ 5.526.888.963 | US$ 17.486.411.450 |
| 1985 | US$ 5.067.330.816 | US$ 17.776.627.208 |
| 1984 | US$ 5.148.384.843 | US$ 16.391.245.675 |
| 1983 | US$ 4.852.572.440 | US$ 17.140.048.793 |
| 1982 | US$ 5.968.583.545 | US$ 16.343.526.469 |
| 1981 | US$ 6.184.035.098 | US$ 16.584.605.960 |
| 1980 | US$ 6.085.317.298 | US$ 17.226.125.073 |
| 1979 | US$ 4.752.055.200 | US$ 12.498.452.242 |
| 1978 | US$ 3.980.131.861 | US$ 9.045.733.047 |
| 1977 | US$ 4.123.911.421 | US$ 7.611.052.224 |
| 1976 | US$ 3.520.253.831 | US$ 6.280.792.834 |
| 1975 | US$ 2.996.086.107 | US$ 6.545.472.951 |
| 1974 | US$ 2.163.914.003 | US$ 5.992.067.751 |
| 1973 | US$ 1.379.890.190 | US$ 4.039.284.329 |
| 1972 | US$ 975.395.583 | US$ 2.650.561.669 |
| 1971 | US$ 859.393.116 | US$ 2.695.673.511 |
| 1970 | US$ 853.751.317 | US$ 2.421.333.333 |
| 1969 | US$ 687.680.442 | US$ 2.356.000.000 |
| 1968 | US$ 656.062.950 | US$ 2.624.000.000 |
| 1967 | US$ 614.564.993 | US$ 2.981.333.333 |
| 1966 | US$ 557.258.289 | US$ 3.041.036.962 |
| 1965 | US$ 497.975.492 | US$ 3.103.803.104 |
| 1964 | US$ 535.521.284 | US$ 3.210.903.211 |
| 1963 | US$ 533.545.171 | US$ 2.860.202.860 |
| 1962 | US$ 501.927.679 | US$ 2.543.102.543 |
| 1961 | US$ 501.927.679 | US$ 2.337.302.337 |
| 1960 | US$ 462.405.814 | US$ 2.530.502.531 |
Em 2025, as importações de bens e serviços do Marrocos foram de US$ 93,3 bilhões e as da Índia, de US$ 950 bilhões: as da Índia foram 10 vezes maiores. Em 1960, as importações da Índia foram 5,5 vezes maiores: US$ 462 milhões do Marrocos e US$ 2,53 bilhões da Índia.
As importações de bens e serviços da Índia têm sido maiores que as do Marrocos todos os anos desde 1960.
Marrocos vs Índia: dados de importações
|
Marrocos
|
Índia
|
|
|---|---|---|
| Importações | US$ 93,3 bi (2025) | US$ 950 bi (2025) |
| Posição mundial | 51/174 | 7/174 |
| Participação mundial | 0,28% | 2,82% |
| % do PIB | 51,1% | 24,0% |
| Maior categoria de bens | Máquinas, eletrônicos e veículos (35,1%, 2025) | Petróleo, gás, minérios e outras matérias-primas (34,4%, 2025) |
| Principal origem dos bens | China (13,9%, 2025) | China (16,6%, 2025) |
Comparar as importações de 2 países quaisquer
Fontes:
- Banco Mundial | Economy & Growth (1960–2025, atualizado em outubro de 2026)
- TradeMap (2001–2025, atualizado em outubro de 2026)
Creative Commons Atribuição (CC BY): você pode copiar, compartilhar, adaptar e reutilizar este conteúdo, inclusive para fins comerciais, desde que cite o statistics.wiki e indique as alterações que fizer. As fontes listadas acima podem ter suas próprias condições de licença.