
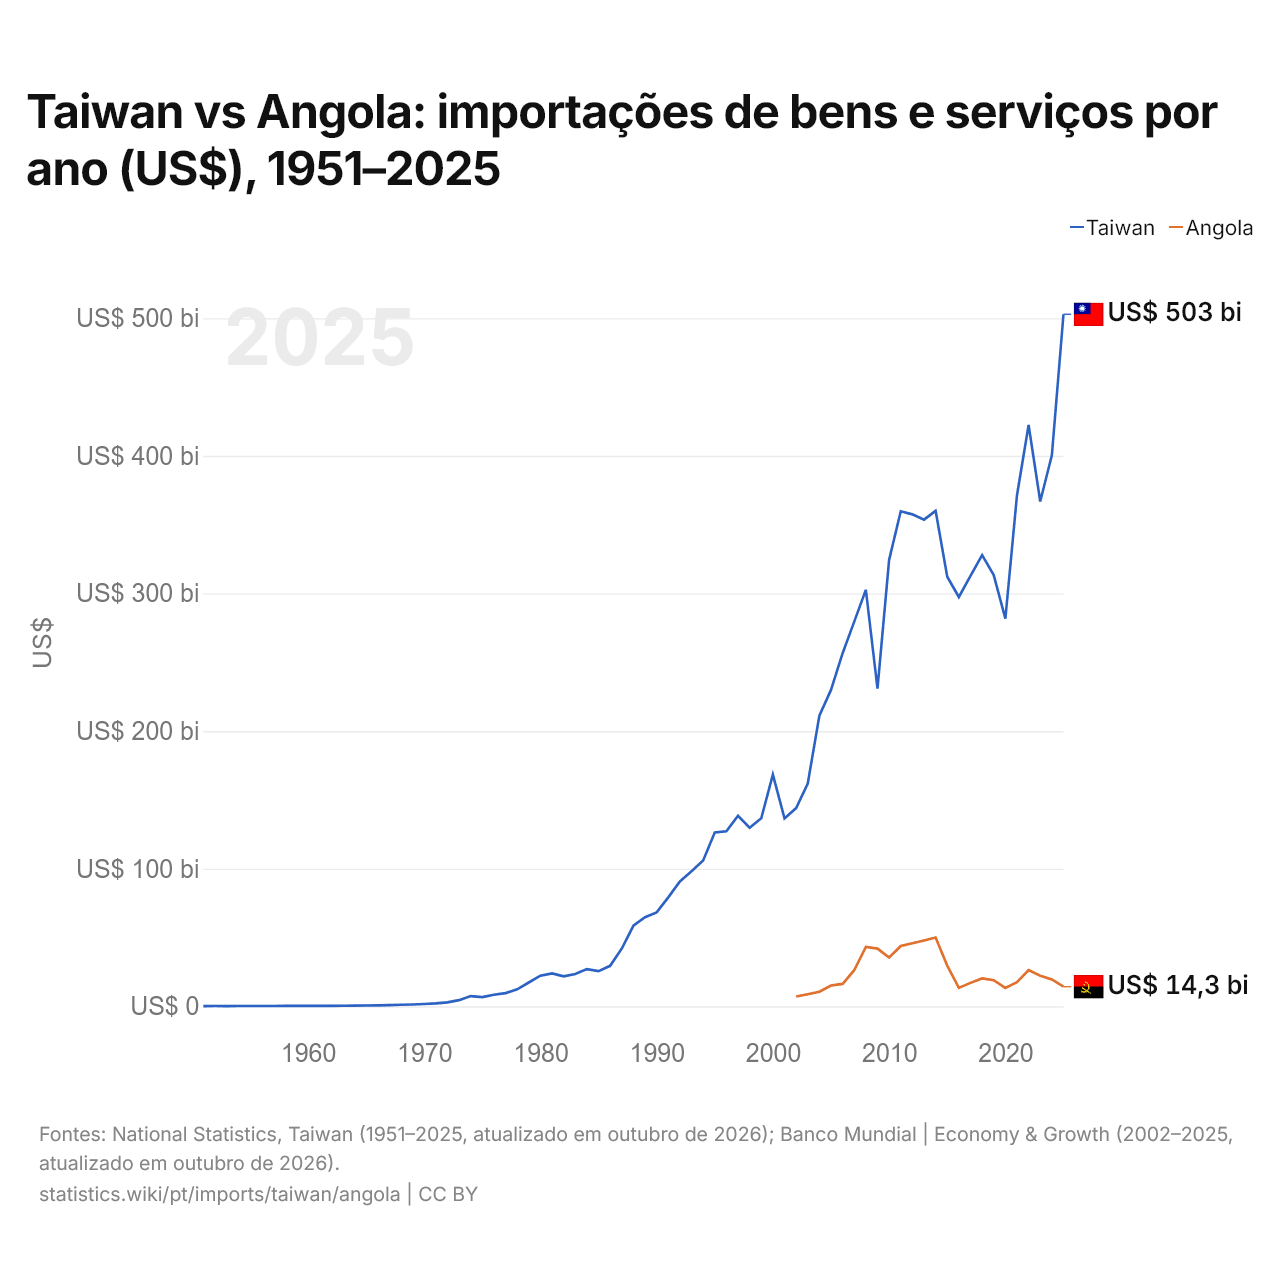
Taiwan vs Angola: importações de bens e serviços por ano (US$), 1951–2025
1x
| Ano | US$ | |
|---|---|---|
 Taiwan |
 Angola |
|
| 2025 | US$ 502.835.299.985 | US$ 14.256.453.829 |
| 2024 | US$ 400.368.455.028 | US$ 19.553.789.239 |
| 2023 | US$ 366.845.807.360 | US$ 22.202.765.695 |
| 2022 | US$ 422.418.389.822 | US$ 26.319.489.923 |
| 2021 | US$ 371.358.687.512 | US$ 17.564.145.355 |
| 2020 | US$ 281.760.577.465 | US$ 13.399.763.094 |
| 2019 | US$ 313.292.602.358 | US$ 19.016.585.500 |
| 2018 | US$ 327.845.590.898 | US$ 20.293.074.054 |
| 2017 | US$ 312.707.879.928 | US$ 17.050.137.821 |
| 2016 | US$ 297.393.618.741 | US$ 13.386.621.550 |
| 2015 | US$ 312.111.514.859 | US$ 29.563.627.047 |
| 2014 | US$ 360.013.581.736 | US$ 49.972.198.759 |
| 2013 | US$ 353.603.335.669 | US$ 47.805.328.238 |
| 2012 | US$ 357.451.322.269 | US$ 45.817.586.149 |
| 2011 | US$ 359.703.351.306 | US$ 43.838.125.871 |
| 2010 | US$ 324.408.301.889 | US$ 35.449.385.343 |
| 2009 | US$ 230.844.879.301 | US$ 41.966.880.323 |
| 2008 | US$ 302.634.491.957 | US$ 43.121.902.048 |
| 2007 | US$ 279.526.946.314 | US$ 26.304.660.777 |
| 2006 | US$ 256.578.743.097 | US$ 16.288.863.668 |
| 2005 | US$ 229.914.322.111 | US$ 15.158.700.249 |
| 2004 | US$ 211.196.602.360 | US$ 10.621.507.095 |
| 2003 | US$ 161.831.083.158 | US$ 8.770.763.873 |
| 2002 | US$ 144.071.527.401 | US$ 7.110.406.406 |
| 2001 | US$ 136.548.195.128 | - |
| 2000 | US$ 168.365.299.685 | - |
| 1999 | US$ 136.655.668.787 | - |
| 1998 | US$ 129.709.711.824 | - |
| 1997 | US$ 138.475.579.073 | - |
| 1996 | US$ 127.198.891.368 | - |
| 1995 | US$ 126.319.235.395 | - |
| 1994 | US$ 105.928.155.394 | - |
| 1993 | US$ 98.100.210.821 | - |
| 1992 | US$ 90.696.690.646 | - |
| 1991 | US$ 79.173.835.551 | - |
| 1990 | US$ 68.210.750.510 | - |
| 1989 | US$ 64.803.743.277 | - |
| 1988 | US$ 58.543.020.885 | - |
| 1987 | US$ 41.947.665.008 | - |
| 1986 | US$ 29.440.547.435 | - |
| 1985 | US$ 25.543.553.844 | - |
| 1984 | US$ 27.048.026.267 | - |
| 1983 | US$ 23.430.464.997 | - |
| 1982 | US$ 21.761.298.705 | - |
| 1981 | US$ 23.973.062.619 | - |
| 1980 | US$ 22.250.970.671 | - |
| 1979 | US$ 17.335.251.305 | - |
| 1978 | US$ 12.325.322.336 | - |
| 1977 | US$ 9.608.186.615 | - |
| 1976 | US$ 8.446.649.280 | - |
| 1975 | US$ 6.657.968.307 | - |
| 1974 | US$ 7.473.065.235 | - |
| 1973 | US$ 4.496.443.005 | - |
| 1972 | US$ 2.846.816.229 | - |
| 1971 | US$ 2.182.167.561 | - |
| 1970 | US$ 1.721.522.319 | - |
| 1969 | US$ 1.358.270.853 | - |
| 1968 | US$ 1.152.446.708 | - |
| 1967 | US$ 881.846.328 | - |
| 1966 | US$ 679.367.368 | - |
| 1965 | US$ 628.589.045 | - |
| 1964 | US$ 489.970.887 | - |
| 1963 | US$ 415.843.754 | - |
| 1962 | US$ 365.351.700 | - |
| 1961 | US$ 369.189.618 | - |
| 1960 | US$ 327.022.147 | - |
| 1959 | US$ 298.405.955 | - |
| 1958 | US$ 304.870.104 | - |
| 1957 | US$ 239.858.443 | - |
| 1956 | US$ 220.671.752 | - |
| 1955 | US$ 242.475.881 | - |
| 1954 | US$ 240.582.579 | - |
| 1953 | US$ 203.801.441 | - |
| 1952 | US$ 236.770.072 | - |
| 1951 | US$ 178.282.794 | - |
Em 2025, as importações de bens e serviços de Taiwan foram de US$ 503 bilhões e as de Angola, de US$ 14,3 bilhões: as de Taiwan foram 35 vezes maiores. Em 2002, as importações de Taiwan foram 20 vezes maiores: US$ 144 bilhões de Taiwan e US$ 7,11 bilhões de Angola.
As importações de bens e serviços de Taiwan têm sido maiores que as de Angola todos os anos desde 2002.
Taiwan vs Angola: dados de importações
|
Taiwan
|
Angola
|
|
|---|---|---|
| Importações | US$ 503 bi (2025) | US$ 14,3 bi (2025) |
| Posição mundial | 18/174 | 106/174 |
| Participação mundial | 1,49% | 0,04% |
| % do PIB | 54,5% | 11,7% |
| Maior categoria de bens | n/d | Máquinas, eletrônicos e veículos (37,3%, 2025) |
| Principal origem dos bens | n/d | China (20,4%, 2025) |
Comparar as importações de 2 países quaisquer
Fontes:
- National Statistics, Taiwan (1951–2025, atualizado em outubro de 2026)
- Banco Mundial | Economy & Growth (2002–2025, atualizado em outubro de 2026)
- TradeMap (2025, atualizado em outubro de 2026)
Creative Commons Atribuição (CC BY): você pode copiar, compartilhar, adaptar e reutilizar este conteúdo, inclusive para fins comerciais, desde que cite o statistics.wiki e indique as alterações que fizer. As fontes listadas acima podem ter suas próprias condições de licença.