
Ruanda vs Angola: importações de bens e serviços por ano (US$), 1960–2025
1x
| Ano | US$ | |
|---|---|---|
 Ruanda |
 Angola |
|
| 2025 | US$ 5.749.666.892 | US$ 14.256.453.829 |
| 2024 | US$ 6.537.889.091 | US$ 19.553.789.239 |
| 2023 | US$ 6.395.220.829 | US$ 22.202.765.695 |
| 2022 | US$ 5.383.473.950 | US$ 26.319.489.923 |
| 2021 | US$ 4.559.111.031 | US$ 17.564.145.355 |
| 2020 | US$ 2.693.399.206 | US$ 13.399.763.094 |
| 2019 | US$ 2.825.715.263 | US$ 19.016.585.500 |
| 2018 | US$ 2.542.570.980 | US$ 20.293.074.054 |
| 2017 | US$ 3.067.749.006 | US$ 17.050.137.821 |
| 2016 | US$ 2.963.474.741 | US$ 13.386.621.550 |
| 2015 | US$ 2.732.477.445 | US$ 29.563.627.047 |
| 2014 | US$ 2.473.485.514 | US$ 49.972.198.759 |
| 2013 | US$ 2.282.582.565 | US$ 47.805.328.238 |
| 2012 | US$ 2.184.617.634 | US$ 45.817.586.149 |
| 2011 | US$ 1.862.381.967 | US$ 43.838.125.871 |
| 2010 | US$ 1.627.421.905 | US$ 35.449.385.343 |
| 2009 | US$ 1.497.497.806 | US$ 41.966.880.323 |
| 2008 | US$ 1.362.351.232 | US$ 43.121.902.048 |
| 2007 | US$ 906.838.771 | US$ 26.304.660.777 |
| 2006 | US$ 737.706.003 | US$ 16.288.863.668 |
| 2005 | US$ 816.931.472 | US$ 15.158.700.249 |
| 2004 | US$ 645.959.492 | US$ 10.621.507.095 |
| 2003 | US$ 544.440.424 | US$ 8.770.763.873 |
| 2002 | US$ 496.596.964 | US$ 7.110.406.406 |
| 2001 | US$ 509.027.986 | - |
| 2000 | US$ 539.149.751 | - |
| 1999 | US$ 558.586.385 | - |
| 1998 | US$ 545.428.793 | - |
| 1997 | US$ 561.473.990 | - |
| 1996 | US$ 427.816.269 | - |
| 1995 | US$ 394.568.196 | - |
| 1994 | US$ 576.838.952 | - |
| 1993 | US$ 477.529.641 | - |
| 1992 | US$ 437.749.056 | - |
| 1991 | US$ 407.725.440 | - |
| 1990 | US$ 423.854.071 | - |
| 1989 | US$ 491.179.726 | - |
| 1988 | US$ 498.141.811 | - |
| 1987 | US$ 487.833.274 | - |
| 1986 | US$ 463.011.469 | - |
| 1985 | US$ 403.055.472 | - |
| 1984 | US$ 368.749.896 | - |
| 1983 | US$ 362.861.261 | - |
| 1982 | US$ 401.475.880 | - |
| 1981 | US$ 361.602.521 | - |
| 1980 | US$ 391.053.243 | - |
| 1979 | US$ 298.152.970 | - |
| 1978 | US$ 254.643.281 | - |
| 1977 | US$ 155.767.696 | - |
| 1976 | US$ 146.123.004 | - |
| 1975 | US$ 119.568.402 | - |
| 1974 | US$ 77.755.906 | - |
| 1973 | US$ 46.170.266 | - |
| 1972 | US$ 47.326.840 | - |
| 1971 | US$ 44.429.204 | - |
| 1970 | US$ 39.573.930 | - |
| 1969 | US$ 32.001.722 | - |
| 1968 | US$ 30.796.787 | - |
| 1967 | US$ 29.051.990 | - |
| 1966 | US$ 29.418.028 | - |
| 1965 | US$ 29.769.045 | - |
| 1964 | US$ 19.373.505 | - |
| 1963 | US$ 19.137.245 | - |
| 1962 | US$ 18.900.981 | - |
| 1961 | US$ 14.175.736 | - |
| 1960 | US$ 14.175.736 | - |
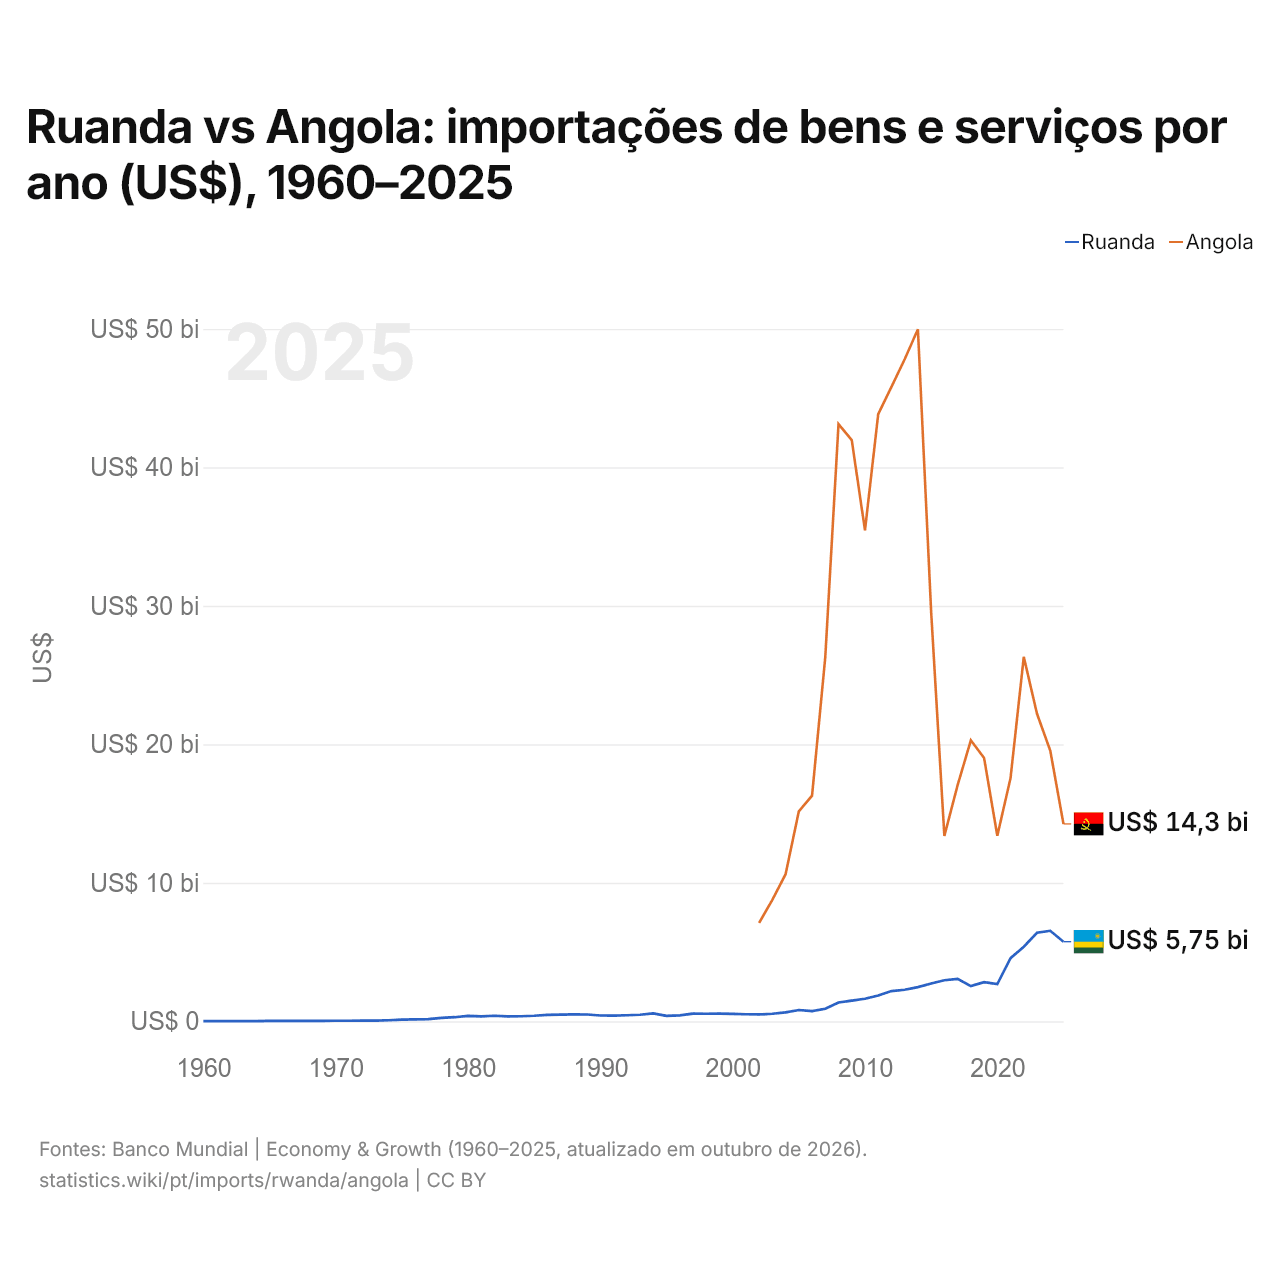
Em 2025, as importações de bens e serviços de Ruanda foram de US$ 5,75 bilhões e as de Angola, de US$ 14,3 bilhões: as de Angola foram 2,5 vezes maiores. Em 2002, as importações de Angola foram 14 vezes maiores: US$ 497 milhões de Ruanda e US$ 7,11 bilhões de Angola.
As importações de bens e serviços de Angola têm sido maiores que as de Ruanda todos os anos desde 2002.
Ruanda vs Angola: dados de importações
|
Ruanda
|
Angola
|
|
|---|---|---|
| Importações | US$ 5,75 bi (2025) | US$ 14,3 bi (2025) |
| Posição mundial | 137/174 | 106/174 |
| Participação mundial | 0,02% | 0,04% |
| % do PIB | 35,1% | 11,7% |
| Maior categoria de bens | Máquinas, eletrônicos e veículos (22,6%, 2025) | Máquinas, eletrônicos e veículos (37,3%, 2025) |
| Principal origem dos bens | China (23,4%, 2025) | China (20,4%, 2025) |
Comparar as importações de 2 países quaisquer
Fontes:
- Banco Mundial | Economy & Growth (1960–2025, atualizado em outubro de 2026)
- TradeMap (2005–2025, atualizado em outubro de 2026)
Creative Commons Atribuição (CC BY): você pode copiar, compartilhar, adaptar e reutilizar este conteúdo, inclusive para fins comerciais, desde que cite o statistics.wiki e indique as alterações que fizer. As fontes listadas acima podem ter suas próprias condições de licença.