
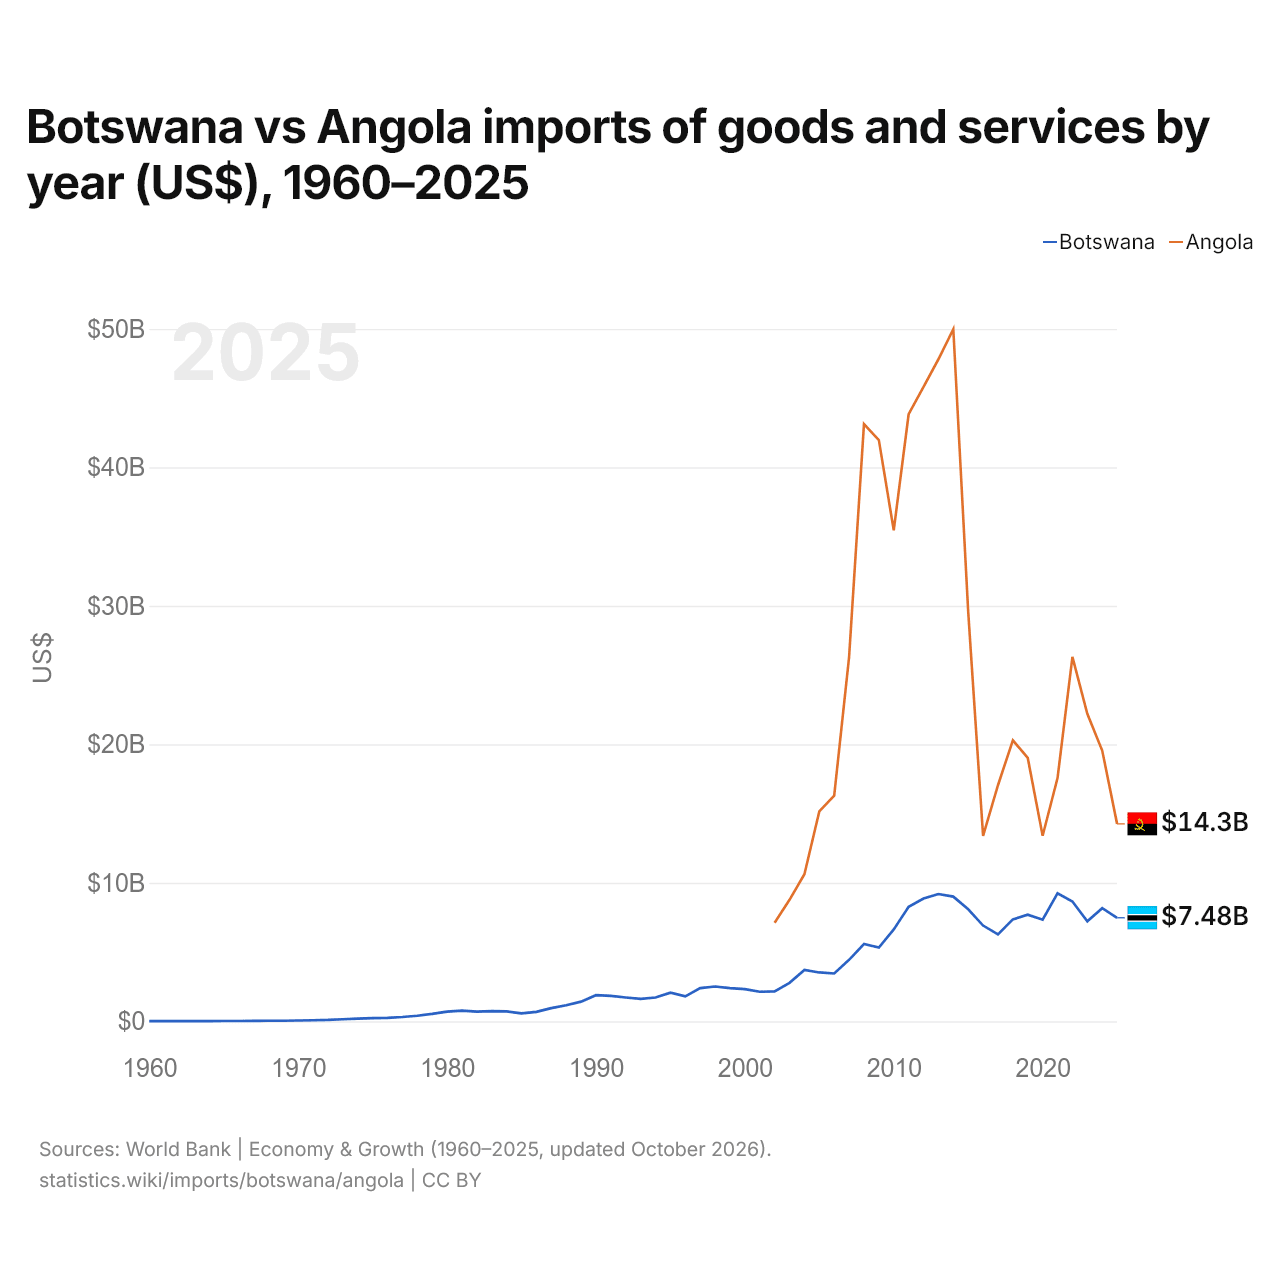
Botsuana vs Angola: importações de bens e serviços por ano (US$), 1960–2025
1x
| Ano | US$ | |
|---|---|---|
 Botsuana |
 Angola |
|
| 2025 | US$ 7.475.356.083 | US$ 14.256.453.829 |
| 2024 | US$ 8.171.323.580 | US$ 19.553.789.239 |
| 2023 | US$ 7.224.959.116 | US$ 22.202.765.695 |
| 2022 | US$ 8.654.887.423 | US$ 26.319.489.923 |
| 2021 | US$ 9.238.937.562 | US$ 17.564.145.355 |
| 2020 | US$ 7.341.599.357 | US$ 13.399.763.094 |
| 2019 | US$ 7.694.781.425 | US$ 19.016.585.500 |
| 2018 | US$ 7.362.391.280 | US$ 20.293.074.054 |
| 2017 | US$ 6.281.640.317 | US$ 17.050.137.821 |
| 2016 | US$ 6.915.892.156 | US$ 13.386.621.550 |
| 2015 | US$ 8.092.740.028 | US$ 29.563.627.047 |
| 2014 | US$ 9.005.846.102 | US$ 49.972.198.759 |
| 2013 | US$ 9.191.467.724 | US$ 47.805.328.238 |
| 2012 | US$ 8.867.435.078 | US$ 45.817.586.149 |
| 2011 | US$ 8.269.310.274 | US$ 43.838.125.871 |
| 2010 | US$ 6.633.895.056 | US$ 35.449.385.343 |
| 2009 | US$ 5.327.078.065 | US$ 41.966.880.323 |
| 2008 | US$ 5.586.611.000 | US$ 43.121.902.048 |
| 2007 | US$ 4.440.003.828 | US$ 26.304.660.777 |
| 2006 | US$ 3.455.002.315 | US$ 16.288.863.668 |
| 2005 | US$ 3.529.325.542 | US$ 15.158.700.249 |
| 2004 | US$ 3.706.961.580 | US$ 10.621.507.095 |
| 2003 | US$ 2.779.825.087 | US$ 8.770.763.873 |
| 2002 | US$ 2.158.051.339 | US$ 7.110.406.406 |
| 2001 | US$ 2.133.671.163 | - |
| 2000 | US$ 2.320.710.338 | - |
| 1999 | US$ 2.398.367.786 | - |
| 1998 | US$ 2.517.487.482 | - |
| 1997 | US$ 2.395.855.332 | - |
| 1996 | US$ 1.799.833.163 | - |
| 1995 | US$ 2.070.047.439 | - |
| 1994 | US$ 1.718.960.980 | - |
| 1993 | US$ 1.627.126.688 | - |
| 1992 | US$ 1.723.755.466 | - |
| 1991 | US$ 1.834.576.022 | - |
| 1990 | US$ 1.887.430.353 | - |
| 1989 | US$ 1.422.760.394 | - |
| 1988 | US$ 1.161.743.378 | - |
| 1987 | US$ 951.998.909 | - |
| 1986 | US$ 684.167.898 | - |
| 1985 | US$ 571.123.119 | - |
| 1984 | US$ 719.207.809 | - |
| 1983 | US$ 733.413.193 | - |
| 1982 | US$ 703.095.485 | - |
| 1981 | US$ 768.101.843 | - |
| 1980 | US$ 704.879.539 | - |
| 1979 | US$ 534.964.730 | - |
| 1978 | US$ 404.573.046 | - |
| 1977 | US$ 313.019.621 | - |
| 1976 | US$ 246.732.562 | - |
| 1975 | US$ 226.569.557 | - |
| 1974 | US$ 198.240.706 | - |
| 1973 | US$ 151.271.981 | - |
| 1972 | US$ 99.569.374 | - |
| 1971 | US$ 78.462.307 | - |
| 1970 | US$ 58.625.320 | - |
| 1969 | US$ 40.665.295 | - |
| 1968 | US$ 41.701.650 | - |
| 1967 | US$ 29.774.772 | - |
| 1966 | US$ 26.220.984 | - |
| 1965 | US$ 23.173.548 | - |
| 1964 | US$ 20.215.850 | - |
| 1963 | US$ 18.034.719 | - |
| 1962 | US$ 15.982.839 | - |
| 1961 | US$ 13.992.002 | - |
| 1960 | US$ 12.056.283 | - |
Em 2025, as importações de bens e serviços de Botsuana foram de US$ 7,48 bilhões e as de Angola, de US$ 14,3 bilhões: as de Angola foram 1,9 vezes maiores. Em 2002, as importações de Angola foram 3,3 vezes maiores: US$ 2,16 bilhões de Botsuana e US$ 7,11 bilhões de Angola.
As importações de bens e serviços de Angola têm sido maiores que as de Botsuana todos os anos desde 2002.
Botsuana vs Angola: dados de importações
|
Botsuana
|
Angola
|
|
|---|---|---|
| Importações | US$ 7,48 bi (2025) | US$ 14,3 bi (2025) |
| Posição mundial | 127/174 | 106/174 |
| Participação mundial | 0,02% | 0,04% |
| % do PIB | 37,5% | 11,7% |
| Maior categoria de bens | Máquinas, eletrônicos e veículos (26,7%, 2025) | Máquinas, eletrônicos e veículos (37,3%, 2025) |
| Principal origem dos bens | África do Sul (60,4%, 2025) | China (20,4%, 2025) |
Comparar as importações de 2 países quaisquer
Fontes:
- Banco Mundial | Economy & Growth (1960–2025, atualizado em outubro de 2026)
- TradeMap (2001–2025, atualizado em outubro de 2026)
Creative Commons Atribuição (CC BY): você pode copiar, compartilhar, adaptar e reutilizar este conteúdo, inclusive para fins comerciais, desde que cite o statistics.wiki e indique as alterações que fizer. As fontes listadas acima podem ter suas próprias condições de licença.