
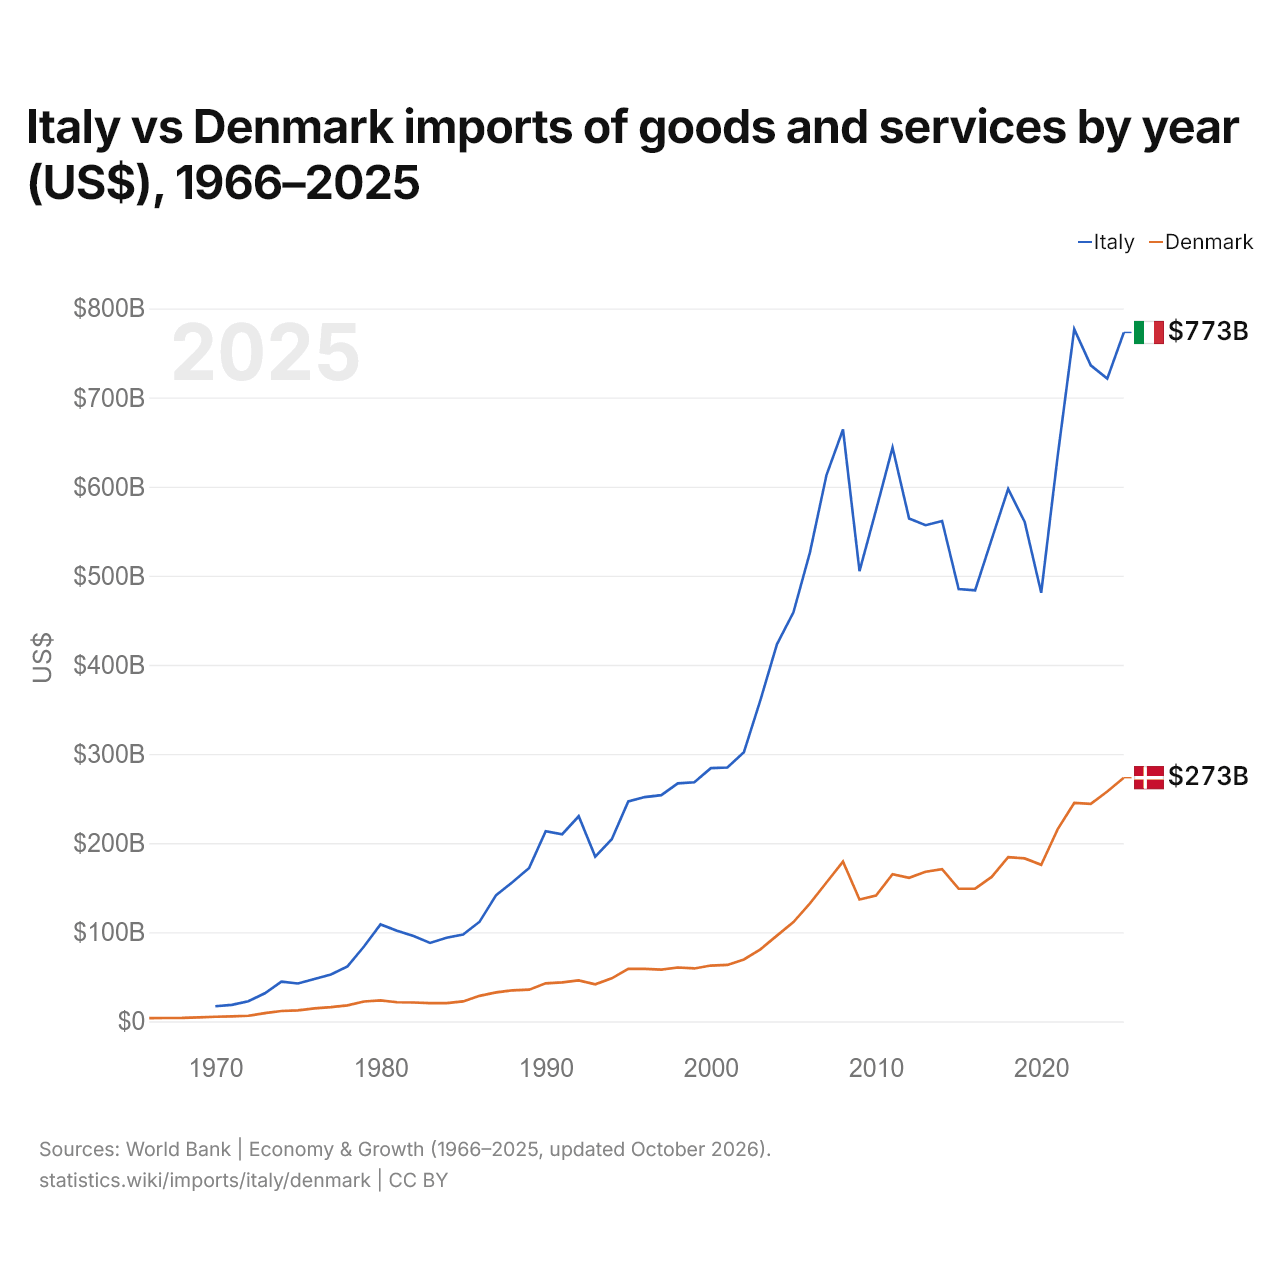
Itália vs Dinamarca: importações de bens e serviços por ano (US$), 1966–2025
1x
| Ano | US$ | |
|---|---|---|
 Itália |
 Dinamarca |
|
| 2025 | US$ 773.024.967.144 | US$ 273.377.454.738 |
| 2024 | US$ 721.169.108.147 | US$ 257.954.032.293 |
| 2023 | US$ 736.153.956.396 | US$ 244.049.390.819 |
| 2022 | US$ 776.766.269.323 | US$ 245.032.442.024 |
| 2021 | US$ 634.811.260.436 | US$ 215.701.858.421 |
| 2020 | US$ 480.945.200.913 | US$ 175.669.403.452 |
| 2019 | US$ 560.326.098.494 | US$ 182.858.534.958 |
| 2018 | US$ 597.530.269.521 | US$ 184.150.748.808 |
| 2017 | US$ 540.827.068.435 | US$ 162.057.186.531 |
| 2016 | US$ 483.730.717.981 | US$ 148.938.310.649 |
| 2015 | US$ 485.192.095.145 | US$ 148.815.553.501 |
| 2014 | US$ 561.398.127.135 | US$ 170.691.434.960 |
| 2013 | US$ 556.753.988.253 | US$ 167.807.403.980 |
| 2012 | US$ 564.328.520.573 | US$ 161.048.079.536 |
| 2011 | US$ 643.858.645.924 | US$ 165.028.065.712 |
| 2010 | US$ 573.630.177.653 | US$ 141.177.531.238 |
| 2009 | US$ 505.183.498.247 | US$ 136.777.444.459 |
| 2008 | US$ 664.125.662.011 | US$ 179.262.473.078 |
| 2007 | US$ 613.038.536.211 | US$ 155.784.301.119 |
| 2006 | US$ 526.275.457.691 | US$ 132.470.258.290 |
| 2005 | US$ 458.978.118.689 | US$ 111.425.808.501 |
| 2004 | US$ 423.101.431.530 | US$ 96.223.902.121 |
| 2003 | US$ 360.433.739.169 | US$ 80.789.965.238 |
| 2002 | US$ 301.961.782.875 | US$ 69.404.219.160 |
| 2001 | US$ 284.831.774.435 | US$ 63.303.119.743 |
| 2000 | US$ 284.121.969.413 | US$ 62.604.702.033 |
| 1999 | US$ 268.274.689.596 | US$ 59.349.185.803 |
| 1998 | US$ 267.089.327.534 | US$ 60.376.476.242 |
| 1997 | US$ 253.824.124.602 | US$ 57.971.293.815 |
| 1996 | US$ 251.644.873.886 | US$ 58.923.841.033 |
| 1995 | US$ 246.820.753.596 | US$ 59.022.090.533 |
| 1994 | US$ 204.277.773.775 | US$ 48.298.831.714 |
| 1993 | US$ 184.878.139.535 | US$ 41.582.171.224 |
| 1992 | US$ 230.163.868.028 | US$ 45.947.462.931 |
| 1991 | US$ 209.893.731.856 | US$ 43.805.725.319 |
| 1990 | US$ 213.356.119.910 | US$ 42.672.845.232 |
| 1989 | US$ 172.137.694.045 | US$ 35.549.320.949 |
| 1988 | US$ 156.326.810.473 | US$ 34.827.127.089 |
| 1987 | US$ 141.632.748.730 | US$ 32.440.355.248 |
| 1986 | US$ 111.807.780.231 | US$ 28.623.980.349 |
| 1985 | US$ 97.337.834.905 | US$ 22.341.632.158 |
| 1984 | US$ 93.843.935.420 | US$ 20.459.800.031 |
| 1983 | US$ 87.973.944.416 | US$ 20.444.406.670 |
| 1982 | US$ 95.659.155.333 | US$ 21.123.371.538 |
| 1981 | US$ 101.717.746.551 | US$ 21.452.392.257 |
| 1980 | US$ 108.750.386.615 | US$ 23.438.722.476 |
| 1979 | US$ 83.952.402.703 | US$ 22.246.206.425 |
| 1978 | US$ 61.718.133.698 | US$ 17.888.293.983 |
| 1977 | US$ 52.626.622.778 | US$ 15.893.622.568 |
| 1976 | US$ 47.521.970.226 | US$ 14.607.323.077 |
| 1975 | US$ 42.506.699.288 | US$ 12.275.876.057 |
| 1974 | US$ 44.460.726.407 | US$ 11.616.217.493 |
| 1973 | US$ 31.517.004.318 | US$ 9.178.240.681 |
| 1972 | US$ 22.528.788.181 | US$ 6.229.703.999 |
| 1971 | US$ 18.471.501.248 | US$ 5.506.203.762 |
| 1970 | US$ 16.935.941.760 | US$ 5.119.854.667 |
| 1969 | - | US$ 4.438.459.867 |
| 1968 | - | US$ 3.829.653.733 |
| 1967 | - | US$ 3.762.160.847 |
| 1966 | - | US$ 3.533.468.959 |
Em 2025, as importações de bens e serviços da Itália foram de US$ 773 bilhões e as da Dinamarca, de US$ 273 bilhões: as da Itália foram 2,8 vezes maiores. Em 1970, as importações da Itália foram 3,3 vezes maiores: US$ 16,9 bilhões da Itália e US$ 5,12 bilhões da Dinamarca.
As importações de bens e serviços da Itália têm sido maiores que as da Dinamarca todos os anos desde 1970.
Itália vs Dinamarca: dados de importações
|
Itália
|
Dinamarca
|
|
|---|---|---|
| Importações | US$ 773 bi (2025) | US$ 273 bi (2025) |
| Posição mundial | 10/174 | 32/174 |
| Participação mundial | 2,29% | 0,81% |
| % do PIB | 30,3% | 59,1% |
| Maior categoria de bens | Máquinas, eletrônicos e veículos (29,8%, 2025) | Máquinas, eletrônicos e veículos (39,1%, 2025) |
| Principal origem dos bens | Alemanha (14,4%, 2025) | Alemanha (19,3%, 2025) |
Comparar as importações de 2 países quaisquer
Fontes:
- Banco Mundial | Economy & Growth (1966–2025, atualizado em outubro de 2026)
- TradeMap (2001–2025, atualizado em outubro de 2026)
Creative Commons Atribuição (CC BY): você pode copiar, compartilhar, adaptar e reutilizar este conteúdo, inclusive para fins comerciais, desde que cite o statistics.wiki e indique as alterações que fizer. As fontes listadas acima podem ter suas próprias condições de licença.