
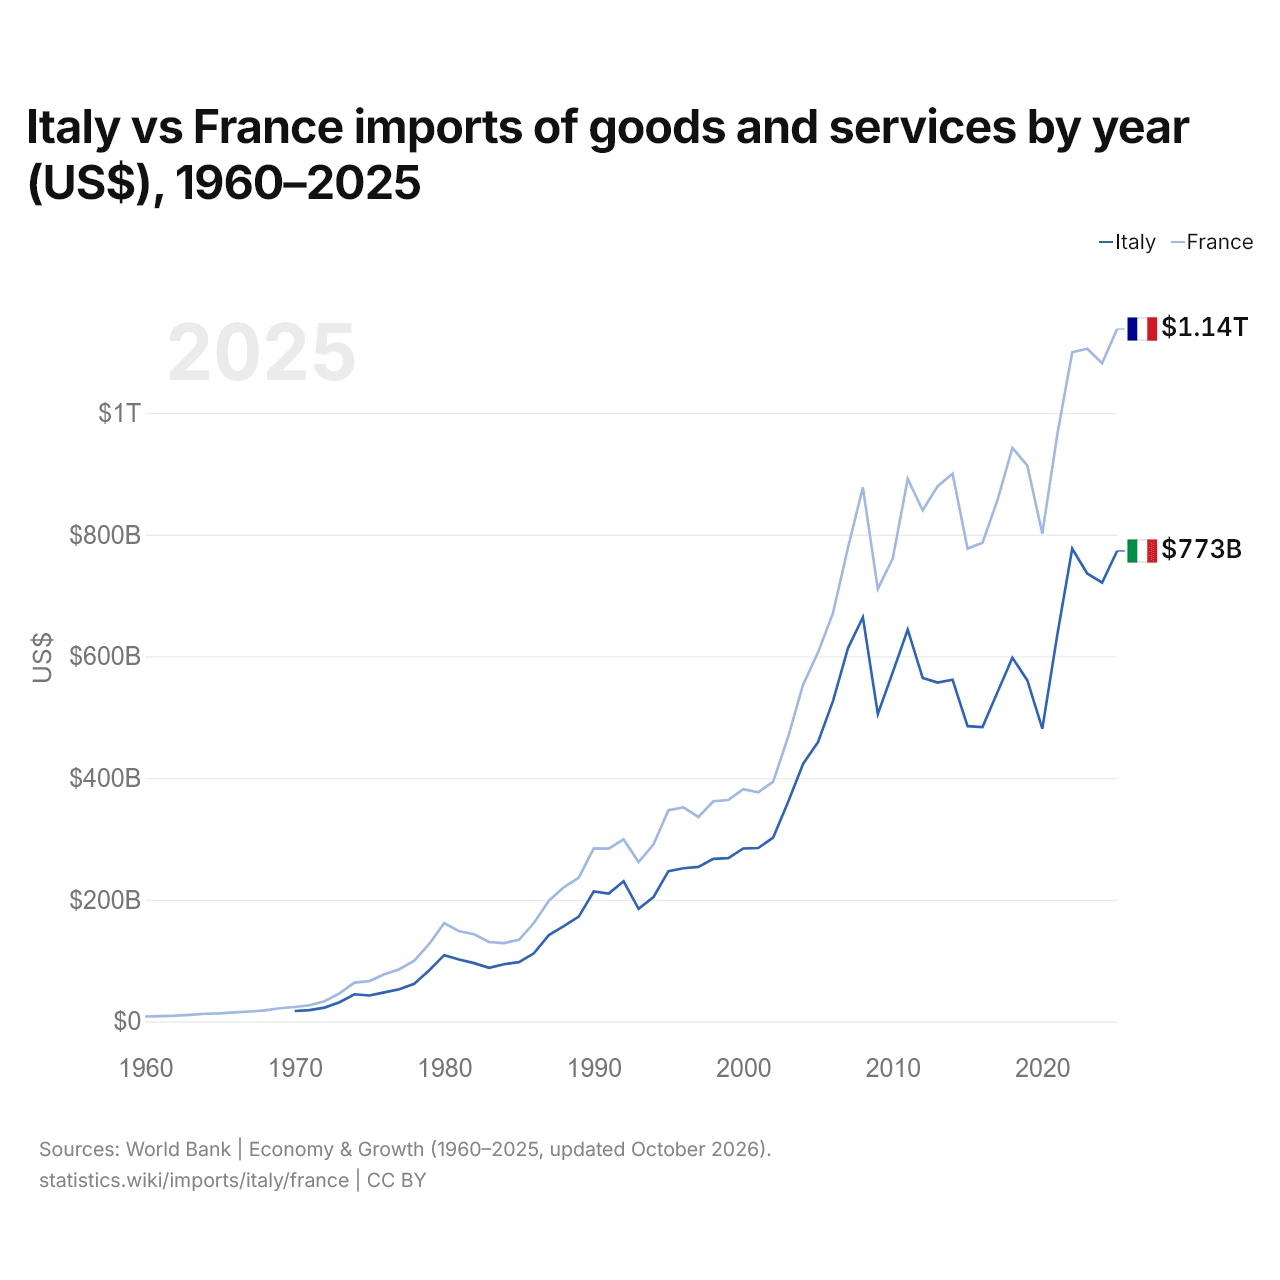
Itália vs França: importações de bens e serviços por ano (US$), 1960–2025
1x
| Ano | US$ | |
|---|---|---|
 Itália |
 França |
|
| 2025 | US$ 773.024.967.144 | US$ 1.137.799.795.607 |
| 2024 | US$ 721.169.108.147 | US$ 1.081.453.951.069 |
| 2023 | US$ 736.153.956.396 | US$ 1.105.442.442.028 |
| 2022 | US$ 776.766.269.323 | US$ 1.099.664.152.806 |
| 2021 | US$ 634.811.260.436 | US$ 964.103.785.592 |
| 2020 | US$ 480.945.200.913 | US$ 801.836.174.373 |
| 2019 | US$ 560.326.098.494 | US$ 913.209.092.424 |
| 2018 | US$ 597.530.269.521 | US$ 942.517.078.079 |
| 2017 | US$ 540.827.068.435 | US$ 856.501.561.408 |
| 2016 | US$ 483.730.717.981 | US$ 786.690.099.965 |
| 2015 | US$ 485.192.095.145 | US$ 776.983.112.153 |
| 2014 | US$ 561.398.127.135 | US$ 900.072.034.980 |
| 2013 | US$ 556.753.988.253 | US$ 879.403.265.970 |
| 2012 | US$ 564.328.520.573 | US$ 839.869.181.340 |
| 2011 | US$ 643.858.645.924 | US$ 891.743.744.380 |
| 2010 | US$ 573.630.177.653 | US$ 761.083.995.458 |
| 2009 | US$ 505.183.498.247 | US$ 710.610.400.819 |
| 2008 | US$ 664.125.662.011 | US$ 877.476.980.121 |
| 2007 | US$ 613.038.536.211 | US$ 777.995.714.258 |
| 2006 | US$ 526.275.457.691 | US$ 670.822.254.333 |
| 2005 | US$ 458.978.118.689 | US$ 606.331.902.820 |
| 2004 | US$ 423.101.431.530 | US$ 553.011.604.110 |
| 2003 | US$ 360.433.739.169 | US$ 467.250.572.393 |
| 2002 | US$ 301.961.782.875 | US$ 394.028.136.002 |
| 2001 | US$ 284.831.774.435 | US$ 376.341.467.532 |
| 2000 | US$ 284.121.969.413 | US$ 381.449.581.352 |
| 1999 | US$ 268.274.689.596 | US$ 363.754.404.232 |
| 1998 | US$ 267.089.327.534 | US$ 361.782.299.311 |
| 1997 | US$ 253.824.124.602 | US$ 335.869.521.241 |
| 1996 | US$ 251.644.873.886 | US$ 351.587.382.998 |
| 1995 | US$ 246.820.753.596 | US$ 346.832.698.121 |
| 1994 | US$ 204.277.773.775 | US$ 291.034.380.907 |
| 1993 | US$ 184.878.139.535 | US$ 261.684.618.948 |
| 1992 | US$ 230.163.868.028 | US$ 299.027.013.631 |
| 1991 | US$ 209.893.731.856 | US$ 283.762.818.277 |
| 1990 | US$ 213.356.119.910 | US$ 284.198.409.830 |
| 1989 | US$ 172.137.694.045 | US$ 235.996.092.947 |
| 1988 | US$ 156.326.810.473 | US$ 220.384.539.148 |
| 1987 | US$ 141.632.748.730 | US$ 198.155.407.618 |
| 1986 | US$ 111.807.780.231 | US$ 161.558.386.211 |
| 1985 | US$ 97.337.834.905 | US$ 133.894.510.147 |
| 1984 | US$ 93.843.935.420 | US$ 128.606.695.189 |
| 1983 | US$ 87.973.944.416 | US$ 130.312.075.049 |
| 1982 | US$ 95.659.155.333 | US$ 143.140.932.229 |
| 1981 | US$ 101.717.746.551 | US$ 148.003.379.602 |
| 1980 | US$ 108.750.386.615 | US$ 161.433.405.775 |
| 1979 | US$ 83.952.402.703 | US$ 127.256.552.575 |
| 1978 | US$ 61.718.133.698 | US$ 99.531.104.651 |
| 1977 | US$ 52.626.622.778 | US$ 85.644.958.545 |
| 1976 | US$ 47.521.970.226 | US$ 77.268.779.022 |
| 1975 | US$ 42.506.699.288 | US$ 66.145.785.529 |
| 1974 | US$ 44.460.726.407 | US$ 63.613.611.566 |
| 1973 | US$ 31.517.004.318 | US$ 45.888.332.351 |
| 1972 | US$ 22.528.788.181 | US$ 33.141.612.484 |
| 1971 | US$ 18.471.501.248 | US$ 26.488.930.981 |
| 1970 | US$ 16.935.941.760 | US$ 23.582.378.647 |
| 1969 | - | US$ 21.479.310.052 |
| 1968 | - | US$ 17.932.241.725 |
| 1967 | - | US$ 16.105.495.991 |
| 1966 | - | US$ 14.747.626.953 |
| 1965 | - | US$ 12.990.103.310 |
| 1964 | - | US$ 12.529.464.175 |
| 1963 | - | US$ 10.693.152.241 |
| 1962 | - | US$ 9.325.584.138 |
| 1961 | - | US$ 8.539.959.909 |
| 1960 | - | US$ 7.955.890.214 |
Em 2025, as importações de bens e serviços da Itália foram de US$ 773 bilhões e as da França, de US$ 1,14 trilhão: as da França foram 47% maiores. Em 1970, as importações da França foram 39% maiores: US$ 16,9 bilhões da Itália e US$ 23,6 bilhões da França.
As importações de bens e serviços da França têm sido maiores que as da Itália todos os anos desde 1970.
Itália vs França: dados de importações
|
Itália
|
França
|
|
|---|---|---|
| Importações | US$ 773 bi (2025) | US$ 1,14 tri (2025) |
| Posição mundial | 10/174 | 5/174 |
| Participação mundial | 2,29% | 3,37% |
| % do PIB | 30,3% | 33,8% |
| Maior categoria de bens | Máquinas, eletrônicos e veículos (29,8%, 2025) | Máquinas, eletrônicos e veículos (38%, 2025) |
| Principal origem dos bens | Alemanha (14,4%, 2025) | Alemanha (12,6%, 2025) |
Comparar as importações de 2 países quaisquer
Fontes:
- Banco Mundial | Economy & Growth (1960–2025, atualizado em outubro de 2026)
- TradeMap (2001–2025, atualizado em outubro de 2026)
Creative Commons Atribuição (CC BY): você pode copiar, compartilhar, adaptar e reutilizar este conteúdo, inclusive para fins comerciais, desde que cite o statistics.wiki e indique as alterações que fizer. As fontes listadas acima podem ter suas próprias condições de licença.