
Itália vs Dinamarca: PIB, 1960–2025
| Ano | PIB, US$ correntes | |
|---|---|---|
 Itália |
 Dinamarca |
|
| 2025 | US$ 2.551.556.954.100 | US$ 462.526.660.468 |
| 2024 | US$ 2.383.435.562.458 | US$ 424.524.722.037 |
| 2023 | US$ 2.316.882.296.366 | US$ 404.651.706.118 |
| 2022 | US$ 2.104.067.630.319 | US$ 400.114.306.337 |
| 2021 | US$ 2.179.207.773.596 | US$ 406.110.162.088 |
| 2020 | US$ 1.907.481.094.079 | US$ 355.631.021.932 |
| 2019 | US$ 2.019.606.796.584 | US$ 345.401.473.013 |
| 2018 | US$ 2.099.435.266.459 | US$ 355.293.374.912 |
| 2017 | US$ 1.970.720.904.585 | US$ 331.610.593.962 |
| 2016 | US$ 1.887.111.188.177 | US$ 312.181.849.372 |
| 2015 | US$ 1.845.428.048.839 | US$ 301.758.922.338 |
| 2014 | US$ 2.173.255.507.986 | US$ 352.832.602.064 |
| 2013 | US$ 2.153.225.581.941 | US$ 344.631.016.965 |
| 2012 | US$ 2.097.929.495.122 | US$ 326.792.574.245 |
| 2011 | US$ 2.306.974.020.278 | US$ 344.315.595.263 |
| 2010 | US$ 2.144.936.254.535 | US$ 322.345.594.075 |
| 2009 | US$ 2.209.484.319.013 | US$ 322.619.152.195 |
| 2008 | US$ 2.417.508.414.187 | US$ 354.979.471.960 |
| 2007 | US$ 2.222.524.108.128 | US$ 320.213.157.595 |
| 2006 | US$ 1.958.563.654.386 | US$ 283.386.151.544 |
| 2005 | US$ 1.864.982.261.287 | US$ 265.150.087.712 |
| 2004 | US$ 1.812.808.753.295 | US$ 251.986.155.631 |
| 2003 | US$ 1.582.930.016.539 | US$ 218.421.193.436 |
| 2002 | US$ 1.281.746.271.196 | US$ 178.788.209.558 |
| 2001 | US$ 1.172.041.488.806 | US$ 164.881.594.415 |
| 2000 | US$ 1.149.661.363.439 | US$ 164.043.817.224 |
| 1999 | US$ 1.255.004.736.464 | US$ 177.887.720.536 |
| 1998 | US$ 1.272.729.786.997 | US$ 176.877.077.513 |
| 1997 | US$ 1.244.988.176.444 | US$ 173.241.365.735 |
| 1996 | US$ 1.314.776.508.972 | US$ 187.481.157.846 |
| 1995 | US$ 1.177.369.428.266 | US$ 184.848.481.008 |
| 1994 | US$ 1.101.750.159.702 | US$ 156.017.919.221 |
| 1993 | US$ 1.067.412.587.671 | US$ 143.111.306.004 |
| 1992 | US$ 1.323.204.350.354 | US$ 152.966.494.260 |
| 1991 | US$ 1.249.092.439.519 | US$ 139.180.507.778 |
| 1990 | US$ 1.183.945.130.899 | US$ 138.217.740.684 |
| 1989 | US$ 930.801.709.004 | US$ 112.312.200.761 |
| 1988 | US$ 893.663.934.841 | US$ 115.540.189.705 |
| 1987 | US$ 807.570.134.449 | US$ 109.183.446.340 |
| 1986 | US$ 641.862.313.287 | US$ 87.748.695.217 |
| 1985 | US$ 453.259.761.687 | US$ 62.452.421.011 |
| 1984 | US$ 438.896.930.791 | US$ 58.868.891.335 |
| 1983 | US$ 444.063.496.940 | US$ 60.331.158.447 |
| 1982 | US$ 428.257.421.618 | US$ 60.084.214.872 |
| 1981 | US$ 431.695.533.981 | US$ 61.459.941.461 |
| 1980 | US$ 478.356.755.596 | US$ 70.811.287.816 |
| 1979 | US$ 394.584.507.108 | US$ 70.393.030.603 |
| 1978 | US$ 315.784.469.541 | US$ 60.320.089.218 |
| 1977 | US$ 258.190.019.750 | US$ 49.711.709.588 |
| 1976 | US$ 225.235.205.862 | US$ 44.503.607.444 |
| 1975 | US$ 228.220.643.535 | US$ 40.418.967.666 |
| 1974 | US$ 200.024.444.775 | US$ 34.125.712.481 |
| 1973 | US$ 175.896.529.392 | US$ 30.718.181.337 |
| 1972 | US$ 145.594.833.997 | US$ 23.230.667.549 |
| 1971 | US$ 124.959.712.859 | US$ 19.086.192.720 |
| 1970 | US$ 113.656.669.765 | US$ 17.075.457.733 |
| 1969 | US$ 100.996.667.239 | US$ 15.414.902.667 |
| 1968 | US$ 91.485.448.148 | US$ 13.505.574.133 |
| 1967 | US$ 84.401.995.573 | US$ 13.059.064.806 |
| 1966 | US$ 76.622.444.787 | US$ 11.931.740.293 |
| 1965 | US$ 70.717.012.186 | US$ 10.870.670.865 |
| 1964 | US$ 65.720.771.779 | US$ 9.677.401.337 |
| 1963 | US$ 60.035.924.618 | US$ 8.466.044.980 |
| 1962 | US$ 52.413.872.628 | US$ 7.953.274.741 |
| 1961 | US$ 46.649.487.320 | US$ 7.058.361.229 |
| 1960 | US$ 42.012.422.612 | US$ 6.361.166.545 |
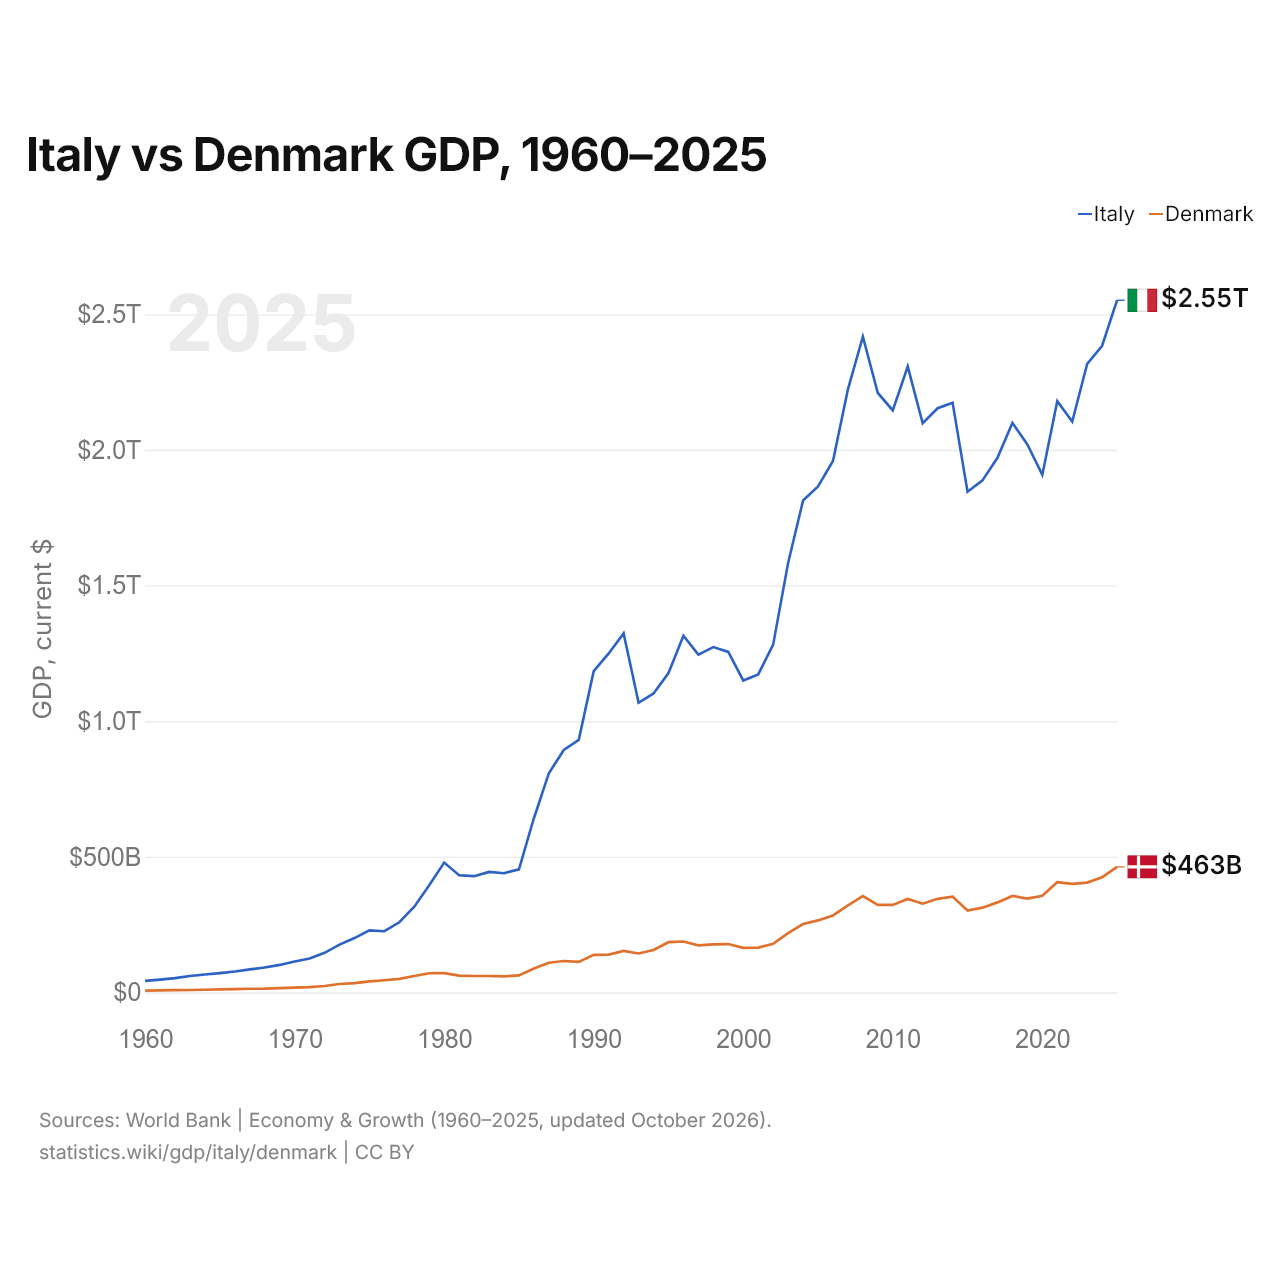
Em 2025, o PIB da Itália (US$ 2,55 trilhões) foi 5,5 vezes o da Dinamarca (US$ 463 bilhões). Em 2015, era 6,1 vezes. De 2015 a 2025, a preços constantes de 2015, o PIB da Itália cresceu 10,8% e o da Dinamarca, 23,9%.
Desde 1960, o PIB da Itália foi o maior dos dois todos os anos; em 1960, era 6,6 vezes o da Dinamarca. Em 2025, o PIB per capita foi de US$ 43.309 na Itália e de US$ 76.970 na Dinamarca, 1,8 vezes maior na Dinamarca.
Itália vs Dinamarca: dados mais recentes do PIB
|
Itália
|
Dinamarca
|
|
|---|---|---|
| PIB, US$ correntes | US$ 2,55 tri | US$ 463 bi |
| Posição mundial | 9/197 | 36/197 |
| Participação mundial | 2,16% | 0,39% |
| PIB, US$ constantes de 2015 | US$ 2,05 tri | US$ 374 bi |
| Diferença de PIB | 5,5× | 0,18× |
Comparar o PIB de 2 países quaisquer
Fontes:
- Banco Mundial | Economy & Growth (1960–2025, atualizado em outubro de 2026)
Creative Commons Atribuição (CC BY): você pode copiar, compartilhar, adaptar e reutilizar este conteúdo, inclusive para fins comerciais, desde que cite o statistics.wiki e indique as alterações que fizer. As fontes listadas acima podem ter suas próprias condições de licença.