
Itália vs Irlanda: PIB, 1960–2025
1x
| Ano | PIB, US$ correntes | |
|---|---|---|
 Itália |
 Irlanda |
|
| 2025 | US$ 2.551.556.954.100 | US$ 721.701.359.046 |
| 2024 | US$ 2.383.435.562.458 | US$ 609.157.459.747 |
| 2023 | US$ 2.316.882.296.366 | US$ 567.372.737.459 |
| 2022 | US$ 2.104.067.630.319 | US$ 548.341.794.599 |
| 2021 | US$ 2.179.207.773.596 | US$ 530.394.123.830 |
| 2020 | US$ 1.907.481.094.079 | US$ 436.009.027.819 |
| 2019 | US$ 2.019.606.796.584 | US$ 407.211.793.801 |
| 2018 | US$ 2.099.435.266.459 | US$ 395.780.319.817 |
| 2017 | US$ 1.970.720.904.585 | US$ 348.355.212.569 |
| 2016 | US$ 1.887.111.188.177 | US$ 305.431.252.709 |
| 2015 | US$ 1.845.428.048.839 | US$ 302.101.388.556 |
| 2014 | US$ 2.173.255.507.986 | US$ 266.490.442.124 |
| 2013 | US$ 2.153.225.581.941 | US$ 242.924.245.719 |
| 2012 | US$ 2.097.929.495.122 | US$ 226.921.827.888 |
| 2011 | US$ 2.306.974.020.278 | US$ 240.975.871.047 |
| 2010 | US$ 2.144.936.254.535 | US$ 221.732.824.603 |
| 2009 | US$ 2.209.484.319.013 | US$ 236.443.115.854 |
| 2008 | US$ 2.417.508.414.187 | US$ 275.447.471.451 |
| 2007 | US$ 2.222.524.108.128 | US$ 270.079.279.420 |
| 2006 | US$ 1.958.563.654.386 | US$ 232.180.617.162 |
| 2005 | US$ 1.864.982.261.287 | US$ 211.876.989.656 |
| 2004 | US$ 1.812.808.753.295 | US$ 194.372.115.041 |
| 2003 | US$ 1.582.930.016.539 | US$ 164.670.771.260 |
| 2002 | US$ 1.281.746.271.196 | US$ 128.596.035.288 |
| 2001 | US$ 1.172.041.488.806 | US$ 109.346.669.230 |
| 2000 | US$ 1.149.661.363.439 | US$ 100.207.610.430 |
| 1999 | US$ 1.255.004.736.464 | US$ 98.893.958.263 |
| 1998 | US$ 1.272.729.786.997 | US$ 90.199.410.116 |
| 1997 | US$ 1.244.988.176.444 | US$ 82.856.648.758 |
| 1996 | US$ 1.314.776.508.972 | US$ 75.790.786.290 |
| 1995 | US$ 1.177.369.428.266 | US$ 69.139.823.232 |
| 1994 | US$ 1.101.750.159.702 | US$ 57.097.656.066 |
| 1993 | US$ 1.067.412.587.671 | US$ 52.417.477.614 |
| 1992 | US$ 1.323.204.350.354 | US$ 55.918.538.121 |
| 1991 | US$ 1.249.092.439.519 | US$ 49.787.501.584 |
| 1990 | US$ 1.183.945.130.899 | US$ 49.305.632.408 |
| 1989 | US$ 930.801.709.004 | US$ 39.238.392.678 |
| 1988 | US$ 893.663.934.841 | US$ 37.772.896.221 |
| 1987 | US$ 807.570.134.449 | US$ 33.920.518.493 |
| 1986 | US$ 641.862.313.287 | US$ 28.714.571.852 |
| 1985 | US$ 453.259.761.687 | US$ 21.270.013.326 |
| 1984 | US$ 438.896.930.791 | US$ 20.106.648.455 |
| 1983 | US$ 444.063.496.940 | US$ 20.766.047.764 |
| 1982 | US$ 428.257.421.618 | US$ 21.474.752.962 |
| 1981 | US$ 431.695.533.981 | US$ 20.670.190.138 |
| 1980 | US$ 478.356.755.596 | US$ 21.747.855.640 |
| 1979 | US$ 394.584.507.108 | US$ 18.319.334.300 |
| 1978 | US$ 315.784.469.541 | US$ 14.647.996.074 |
| 1977 | US$ 258.190.019.750 | US$ 11.248.340.431 |
| 1976 | US$ 225.235.205.862 | US$ 9.453.756.015 |
| 1975 | US$ 228.220.643.535 | US$ 9.483.808.362 |
| 1974 | US$ 200.024.444.775 | US$ 7.896.860.615 |
| 1973 | US$ 175.896.529.392 | US$ 7.481.173.066 |
| 1972 | US$ 145.594.833.997 | US$ 6.318.060.582 |
| 1971 | US$ 124.959.712.859 | US$ 5.098.250.287 |
| 1970 | US$ 113.656.669.765 | US$ 4.395.995.086 |
| 1969 | US$ 100.996.667.239 | US$ 3.902.721.632 |
| 1968 | US$ 91.485.448.148 | US$ 3.378.701.147 |
| 1967 | US$ 84.401.995.573 | US$ 3.445.739.915 |
| 1966 | US$ 76.622.444.787 | US$ 3.198.820.904 |
| 1965 | US$ 70.717.012.186 | US$ 3.035.655.794 |
| 1964 | US$ 65.720.771.779 | US$ 2.851.091.646 |
| 1963 | US$ 60.035.924.618 | US$ 2.505.073.358 |
| 1962 | US$ 52.413.872.628 | US$ 2.329.372.972 |
| 1961 | US$ 46.649.487.320 | US$ 2.151.772.980 |
| 1960 | US$ 42.012.422.612 | US$ 1.998.550.222 |
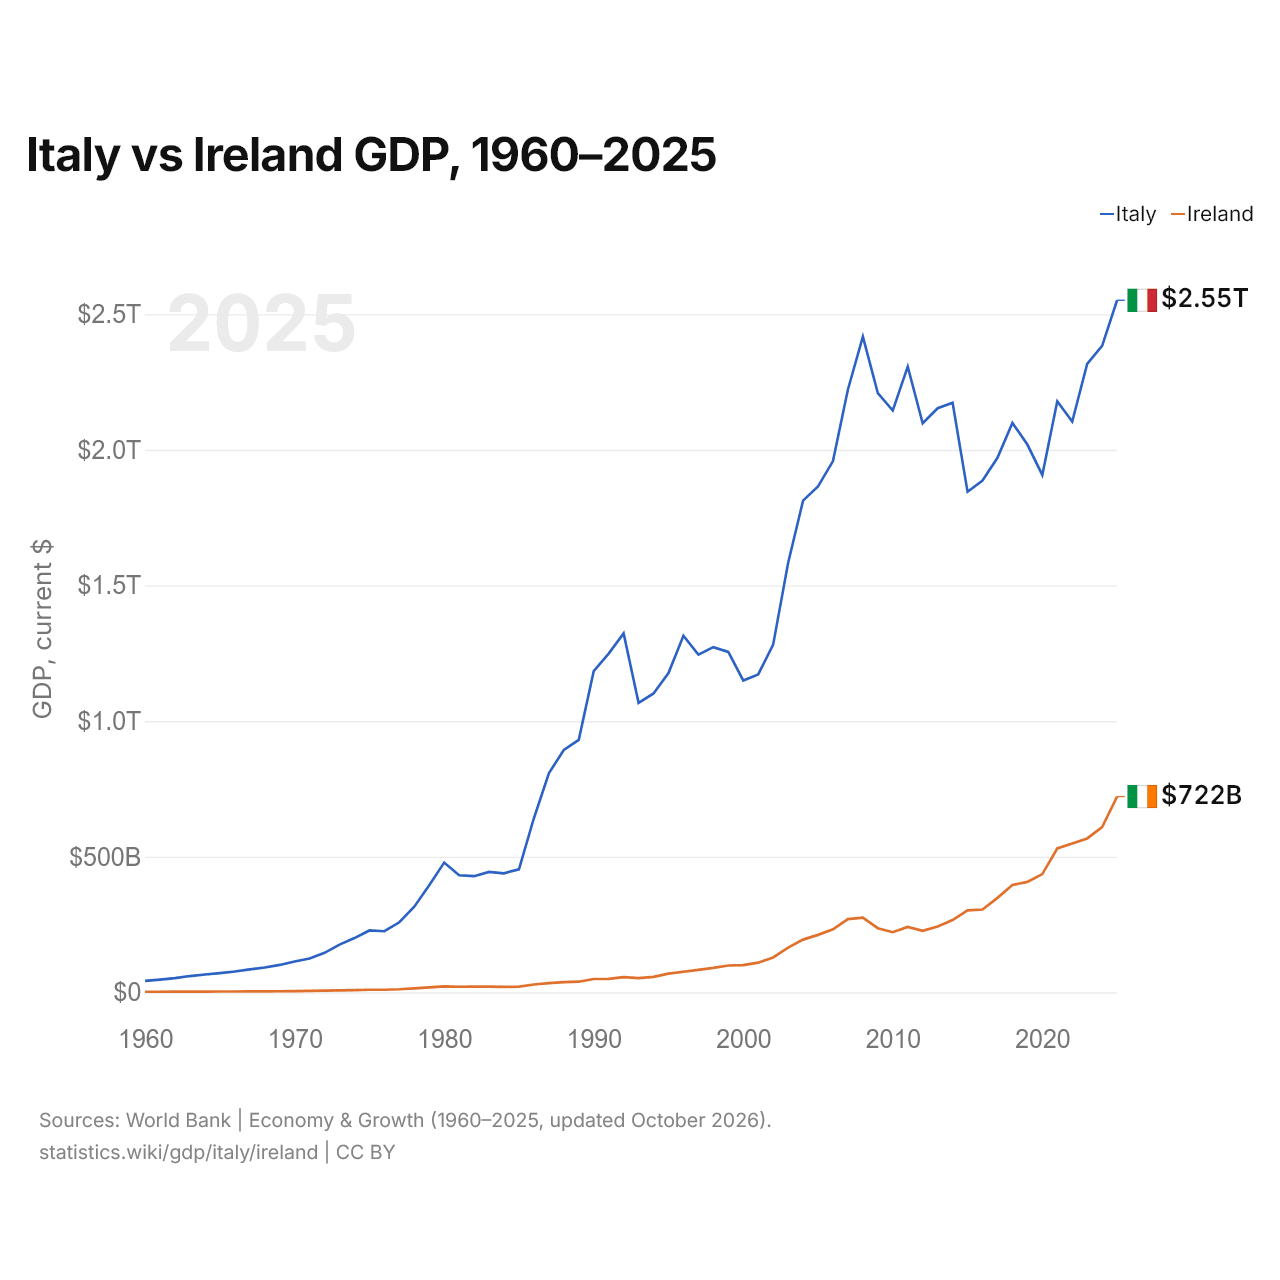
Em 2025, o PIB da Itália (US$ 2,55 trilhões) foi 3,5 vezes o da Irlanda (US$ 722 bilhões). Em 2015, era 6,1 vezes. De 2015 a 2025, a preços constantes de 2015, o PIB da Itália cresceu 10,8% e o da Irlanda, 89,6%.
Desde 1960, o PIB da Itália foi o maior dos dois todos os anos; em 1960, era 21 vezes o da Irlanda. Em 2025, o PIB per capita foi de US$ 43.309 na Itália e de US$ 131.592 na Irlanda, 3,0 vezes maior na Irlanda.
Itália vs Irlanda: dados mais recentes do PIB
|
Itália
|
Irlanda
|
|
|---|---|---|
| PIB, US$ correntes | US$ 2,55 tri | US$ 722 bi |
| Posição mundial | 9/197 | 24/197 |
| Participação mundial | 2,16% | 0,61% |
| PIB, US$ constantes de 2015 | US$ 2,05 tri | US$ 573 bi |
| Diferença de PIB | 3,5× | 0,28× |
Comparar o PIB de 2 países quaisquer
Fontes:
- Banco Mundial | Economy & Growth (1960–2025, atualizado em outubro de 2026)
Creative Commons Atribuição (CC BY): você pode copiar, compartilhar, adaptar e reutilizar este conteúdo, inclusive para fins comerciais, desde que cite o statistics.wiki e indique as alterações que fizer. As fontes listadas acima podem ter suas próprias condições de licença.